Embarking on the journey of flag pattern exploration suggests you’re a burgeoning trader, thirsty for insights. You’re on the right path. Mastering stock market patterns is the cornerstone of trading success. As you delve into this article, you’ll uncover the art of leveraging of pattern adeptly. With vivid diagrams and insightful descriptions, consider this your roadmap to triumph. Here’s to your prosperous trading endeavors, aspiring trader!
What is a Flag Pattern?
The pattern is a key signal in technical analysis, indicating a pause in the current trend before its continuation. It forms after a sharp price movement and consists of parallel support and resistance lines. Traders watch for breakouts above or below these boundaries to determine potential long or short trading opportunities, respectively. Understanding the flag formation helps traders make informed decisions and capitalize on market trends effectively.
Bull Flag Pattern
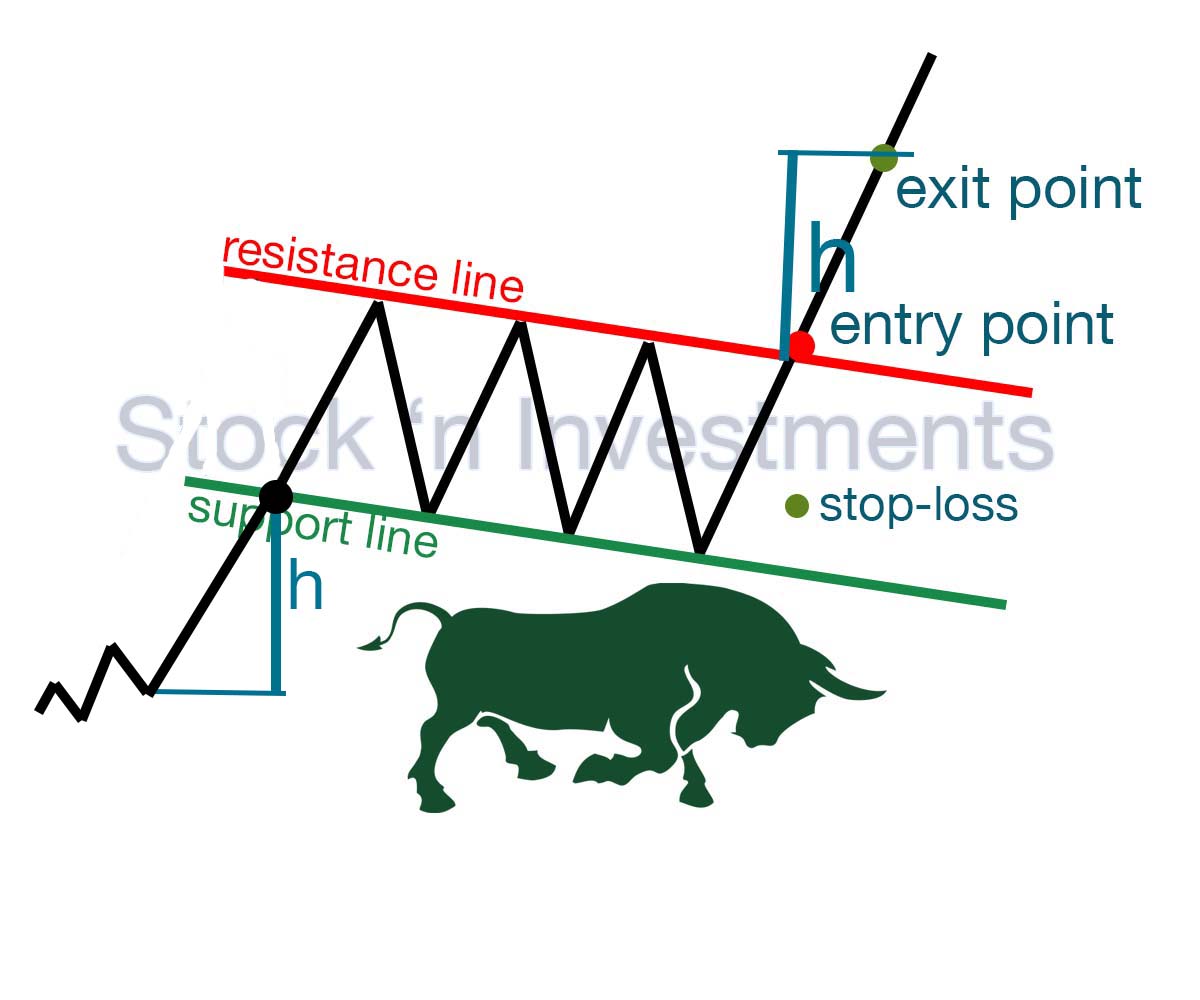
The bull flag formation is a bullish continuation trend that forms after a strong upward price movement. It consists of a consolidation period, represented by a downward sloping channel or flag, followed by a breakout to the upside, indicating a potential continuation of the uptrend.
Volume
Volume plays a crucial role in confirming the validity and strength of this pattern.
The first part of the bull flag pattern is a strong upward price movement (the flagpole) accompanied by increasing volume. This indicates strong buying interest and momentum.
After the sharp uptrend, the price enters a consolidation phase, forming the “flag” part of the chart. During this phase, the price typically moves sideways or slightly downward in a parallel or downward-sloping channel. Volume should decrease during this phase, reflecting reduced buying and selling activity as traders take a breather.
The formation is confirmed when the price breaks out above the upper boundary of the bullish flag pattern with a significant increase in volume. This volume increase indicates renewed buying interest and suggests that the uptrend is likely to continue.
Entry point
To successfully enter a trade using the bull flag pattern, follow these steps:
- Identify the pattern.
- Wait for a breakout above the upper boundary of the flag.
- Ensure the breakout is confirmed by an increase in trading volume.
- Enter the trade after the price closes above the upper boundary of the flag with high volume.
Stop-loss
When trading the pattern, setting an appropriate stop-loss is crucial to managing risk.
Below the flag. A common strategy is to place the stop-loss just below the lowest point of the flag portion of the formation. This level acts as a support, and if the price falls below this point, it might indicate that the pattern has failed.
Below the flagpole start. Another conservative approach is to place the stop-loss below the lowest point of the flagpole of the bullish flag pattern. This gives more room for the trade to develop but also increases the risk.
Percentage-based stop-loss. You can also set a stop-loss based on a fixed percentage below the breakout point or the entry price. For example, setting a stop-loss 2-3% below the entry point can help manage risk according to your risk tolerance.
ATR (average true range). Using the ATR indicator can help set a stop-loss based on the market’s volatility. Multiply the ATR value by a factor (e.g., 1.5 or 2) and place the stop-loss below the breakout point by this amount.
Below a key moving average: If a key moving average, such as the 50-period or 200-period moving average, is close to the lower boundary of the flag, you can place the stop-loss just below this moving average for additional support.
Exit point (take profit)
To set a take profit level for the bull flag pattern:
- Measure the flagpole length. Calculate the distance of the initial strong upward move.
- Project the flagpole length. Add this distance to the breakout point above the flag’s upper boundary.
- Set the take profit level. Use this projected price as your take profit target.
Bear Flag Pattern
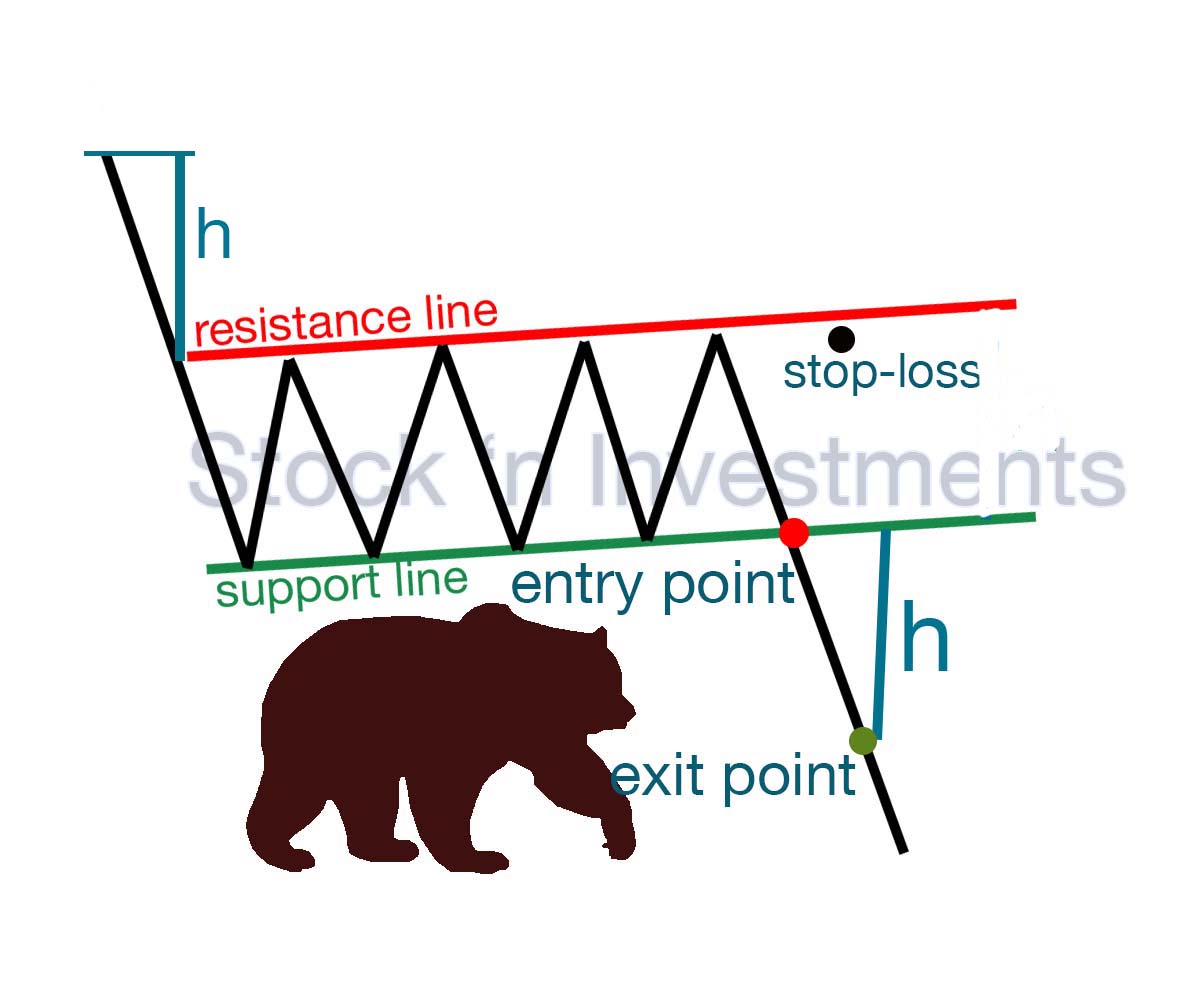
The bear flag formation is a bearish continuation pattern that typically forms after a significant downward price movement. It consists of a consolidation period, represented by an upward sloping channel or flag, followed by a breakout to the downside, signaling a potential continuation of the downtrend. Traders regularly interpret this pattern as a signal to enter short positions, expecting the downward momentum to continue.
Volume
The first part of the pattern is a strong downward price movement (the flagpole) accompanied by increasing volume. This indicates strong selling interest and momentum.
After the sharp downtrend, the price enters a consolidation phase, forming the “flag” part of the structure. During this phase, the price typically moves sideways or slightly upward in a parallel or upward-sloping channel. Volume should decrease during this phase, reflecting reduced buying and selling activity as traders take a breather.
The formation is confirmed when the price breaks down below the lower boundary of the flag pattern with a significant increase in volume. This volume increase indicates renewed selling interest and suggests that the downtrend is likely to continue.
Entry point
To successfully enter a trade using the bearish flag pattern, follow these steps:
- Identify the pattern.
- Confirm the breakdown.
- Volume confirmation.
- Entry point.
Stop-loss
When trading the bear flag pattern, it’s crucial to set a stop-loss to protect your capital.
Above the flag
- The simplest and most common method is to place the stop-loss just above the upper boundary of the flag. This line serves as resistance during the consolidation phase.
- Why? If the price breaks above this line, it might indicate that the bearish trend has reversed and the pattern is no longer valid.
Above the flagpole start
- For a more conservative approach, you can place the stop-loss above the start of the flagpole in the bear flag pattern. This gives a bit more room for price fluctuations but increases the potential risk.
- Why? If the price returns to the start of the flagpole, it indicates a significant reversal in the trend.
ATR-based stop-loss:
- Use the Average True Range (ATR) to set a stop-loss. The ATR measures price volatility.
- How? Calculate the ATR value and multiply it by 1.5 or 2, then add it to the breakdown point to determine your stop-loss level.
- Why? This method adjusts the stop-loss based on the stock’s volatility, providing a dynamic risk management approach.
Percentage-based stop-loss:
- Decide on a fixed percentage (e.g., 2% or 3%) above the entry point for the stop-loss.
- How? Calculate this percentage and add it to the entry point to determine the stop-loss level.
- Why? This is a simple and consistent way to manage risk.
Exit point (take profit)
To successfully determine the exit point using the bearish flag pattern:
- Measure the flagpole. Calculate the distance of the initial strong downward move.
- Project the flagpole length. Subtract this distance from the breakdown point below the flag’s lower boundary.
- Set the exit point. Use this projected price as your exit target.
Is the Flag Pattern Reliable?
Flag patterns are highly regarded by traders as dependable continuation patterns. They offer a setup to enter an ongoing trend poised to extend further. These formations share similar characteristics and often emerge in comparable circumstances within an existing trend.
What are the benefits of using a trailing stop in the flag pattern?
Protecting profits. A trailing stop allows you to lock in profits if the price moves in your favor.
Limiting losses. A trailing stop limits losses in the event of an unfavorable market move.
Reducing psychological pressure. Automatically moving the trailing stop reduces the need to constantly monitor the market.
Should you trade the flag pattern in times of high volatility?
Trading the pattern during periods of high volatility can be risky but also potentially rewarding.
Benefits of trading
Quick Profits. High volatility can lead to rapid price movements, allowing for quick profit if you correctly identify the pattern and entry point.
Clear Patterns. Patterns may be more pronounced and easier to identify during high volatility, aiding in decision-making.
Drawbacks of trading
Increased risk. High volatility can result in unpredictable price swings, increasing the risk of losses if the market moves against you in the flag pattern.
Wider stop-losses. Strong volatility may require setting wider stop-losses to avoid premature trade closure, which raises risk exposure.
Risk management complexity. Managing risks and adhering to trading strategies become more challenging as market conditions change rapidly.
Should you trade the flag pattern on cryptocurrency markets?
Trading the pattern on cryptocurrency markets can be profitable but demands caution and adaptation to the market’s unique dynamics. It’s crucial to consider the high volatility and associated risks when planning and executing trades.
Advantages of trading
High volatility. Cryptocurrency markets are known for their high volatility, which can create favorable conditions for identifying and using the flag pattern.
Fast price movements. Frequent price changes can accelerate price movements upward or downward, allowing for quick profit-taking if you accurately identify the pattern and entry point.
Drawbacks of trading
High risk. Features like price instability in cryptocurrency markets can increase the risk of losses.
Market variability. Different cryptocurrency assets may behave differently during the formation of the flag pattern, requiring additional analysis and caution.
Pingback: Stock Market Patterns Bulls & Bears
Pingback: Stock Market Patterns, 12 options Stock 'n Investments