Author Archives: VADYM KHOMUTOVSKYI

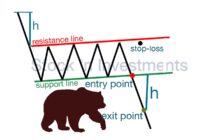
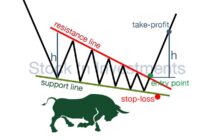
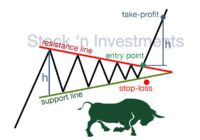
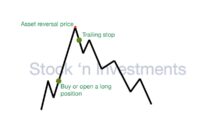
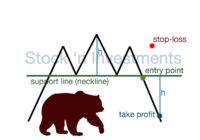
Inverse Cup and Handle: Entry & Exit Point, Stop-Loss, Volume

By | July 12, 2024

The inverse cup and handle pattern is a bearish reversal pattern, indicating a potential decline in price following a brief consolidation period. It is called an inverted cup and handle or upside-down cup and handle, and it is one of the stock market patterns. Steps for trading the inverse cup and handle pattern Identify the… Read More »

Bull & Bear Flag Pattern Trading

By | June 24, 2024

Mastering bull & bear flag pattern trading can significantly enhance your ability to predict market trends and make informed trading decisions. Flag patterns can be powerful tools for trading in trending markets. By understanding their formation and using proper entry, stop-loss, and profit target strategies, traders can effectively capitalize on these patterns. Bull flag pattern… Read More »

Wedge Pattern Trading: How It Works?

By | June 19, 2024

Wedge patterns are a key concept of stock market patterns, offering traders insights into potential price movements. Understanding and trading these patterns effectively can significantly enhance your trading position in wedge pattern trading. Let’s consider two types of wedge patterns. Rising wedge pattern trading Let’s consider ABC Corp, which is currently trading at $50 and… Read More »

Triangle Pattern Trading: Examples and Advice for 4 Patterns

By | June 18, 2024

Triangle pattern trading: why 4 formations and not 3? These patterns are popular chart patterns in technical analysis that can indicate the continuation or reversal of a trend. There are three main types of triangle patterns: ascending, descending, and symmetrical. A symmetrical triangle comes in two types: bullish and bearish. All these patterns belong to… Read More »

Trailing Stop Order: Everything You Need to Know Today

By | June 13, 2024

A trailing stop (TS) is a powerful stock market tool that helps traders automatically protect their profits and limit losses as the price of an asset moves in a favorable direction. Unlike a fixed stop-loss, a TS dynamically adjusts, maintaining a set distance from the current market price. What is a trailing stop? A TS… Read More »

Power of Bear Flag Pattern: Profit and Optimal Technical Indicators

By | June 23, 2024

A bear flag pattern is a technical analysis chart pattern that indicates a continuation of a downtrend in the market. It forms when the price of a security declines sharply, then consolidates slightly higher in a small upward-sloping channel or rectangle, resembling a flag on a pole. It is one of stock market patterns. Bear… Read More »

Bull Flag Pattern Trading: Strategies, Tips and Techniques

By | June 23, 2024

A bull flag pattern is a key chart pattern in technical analysis that signals the continuation of an uptrend. It’s one of stock market patterns. It has two main parts: the flagpole and the flag. Flagpole. This is the initial, sharp upward price movement, showing strong buying interest and momentum. Flag. Following the flagpole, there’s… Read More »

Head and Shoulders Chart Pattern: Entry and Exit Points

By | July 14, 2024

The head and shoulders chart pattern is a popular stock market patterns that signal a potential reversal in trend. There is the classic and the inverse head and shoulders, which indicates a bullish reversal in a downtrend when the price breaks above the neckline. For successful trading, it is essential to correctly determine entry and… Read More »

Cup and Handle: Breakout, Stop-Loss, Volume & Indicators

By | July 14, 2024

The cup and handle pattern is a classic bullish technical analysis pattern that signals the continuation of an upward trend. It is one of the stock market patterns. To trade successfully in the markets, it is essential to study this pattern. Cup and handle breakout Identification. The pattern starts with a rounded bottom (the cup)… Read More »

The Significance of Using Stock Technical Indicators for Trading

By | June 2, 2024

Stock technical indicators are mathematical calculations based on the price, volume, or open interest of a security or contract. They are used by traders to analyze and predict future price movements, as well as to confirm breakouts in stock market patterns. Types of stock technical indicators Moving Averages (MA) Moving Averages are used to identify… Read More »

Essential Techniques for Trading Analysis

By | May 29, 2024

Trading analysis involves a variety of methods and tools to evaluate and make informed decisions about market movements. To trade successfully in financial markets, you need to be prepared and have the necessary knowledge. Trading without it is possible, but such trading will bring disappointment in 99% of cases. Therefore, I advise you to familiarize… Read More »

Inverted Cup and Handle: Entry and Exit Points

By | July 14, 2024

The inverted cup and handle pattern is a bearish continuation pattern that typically indicates a potential decline in prices after a period of consolidation. This pattern is the inverse of the bullish cup and handle pattern and is used by traders to identify selling opportunities. This is one of the stock market patterns. Key characteristics… Read More »

Symmetrical Triangle Pattern in Technical Analysis

By | July 14, 2024

The symmetrical triangle pattern is a continuation pattern often observed in stock market patterns. It is characterized by two converging trend lines connecting a series of sequential peaks and troughs. These trend lines form a triangle that points towards the right, suggesting a period of consolidation before the price breaks out in the direction of… Read More »

Descending Wedge Pattern: Entry & Exit Points

By | July 14, 2024

At first glance, trading seems simple. You just need to know two points: the entry point into a position and the exit point from it. The problem is that no one knows exactly where these points are. However, there are certain patterns, called stock market patterns or technical analysis figures, that can help. Let’s find… Read More »

Ascending Wedge Pattern: How to Use It?

By | July 14, 2024

The ascending wedge pattern, also known as a rising wedge pattern, is typically viewed as a bearish chart pattern in stock market patterns or technical analysis. It indicates a potential reversal or continuation of a downtrend. This pattern is formed by two converging trend lines that slope upwards, indicating a weakening uptrend. Types of ascending… Read More »

How to Use the Descending Triangle Pattern?

By | July 14, 2024

The main idea of the descending triangle pattern is that this technical analysis pattern signals a potential downward price breakout. A descending triangle forms when the price of an asset creates a series of lower highs, forming a descending trend line, while the lows remain roughly at the same level, forming a horizontal support line.… Read More »

Ascending Triangle Pattern: Technical Analysis

By | July 13, 2024

This is one of the stock market patterns. The importance of the ascending triangle pattern lies in its ability to serve as a signal for trend continuation. When the price approaches the upper horizontal line (resistance) and forms higher lows, it may indicate increasing demand and an attempt by the market to overcome resistance. Traders… Read More »

Falling Wedge Pattern: Technical Analysis & Analytics

By | July 13, 2024

The importance of the falling wedge pattern lies in its potential to signal a possible change in the price direction. This pattern often occurs during a downtrend and may indicate a weakening bearish market sentiment. When the price enters a falling wedge, it could suggest a reduction in selling pressure and a trend reversal. Therefore,… Read More »

Rising Wedge Pattern: What to Pay Attention to?

By | July 14, 2024

The rising wedge pattern is one of the most challenging stock market patterns in technical analysis. This pattern typically emerges during an uptrend and is classified as a reversal pattern. Also, this pattern is classified as bearish patterns. It can be found on a price chart when prices form higher and lower points that rise… Read More »

Real Estate Investing: How to Do Analytics?

By | May 5, 2024

Real estate investing is one of the best types of alternative investments, which is resilient to inflation, stable, and can appreciate over time. However, before investing, it’s necessary to make informed and accurate decisions, the foundation of which is conducting analytics. Types of real estate investing At the first stage, it is necessary to determine… Read More »