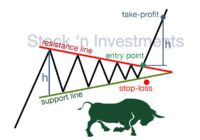
Symmetrical Triangle Pattern in Technical Analysis
The symmetrical triangle pattern is a continuation pattern often observed in stock market patterns. It is characterized by two converging trend lines connecting a series of sequential peaks and troughs. These trend lines form a triangle that points towards the right, suggesting a period of consolidation before the price breaks out in the direction of… Read More »
