Embarking on the exploration of triangle patterns suggests you’re an aspiring trader, eager for knowledge. You’re on the right path. Mastering technical analysis patterns is crucial for trading success. By the end of this article, you’ll have a firm grasp on how to effectively utilize triangle patterns. With vivid diagrams and clear descriptions, consider this your roadmap to success. Here’s to your journey as a successful trader!
What is Triangle Patterns?
Triangle patterns are fundamental in stock market analysis. They provide insights into market trends, price dynamics, and optimal entry and exit points. Typically, depicted using candlestick charts, it aids traders in making informed decisions based on price statistics. Appearing across various timeframes, wider timeframes enhance price forecasts’ accuracy.
The triangle comprises two straight lines intersecting at an acute angle. These lines pass through the minimum and maximum price levels. The following aspects set it apart:
- One side of the triangle forms a horizontal line. Its position, whether lower or upper, depends on the prevailing price trend.
- If drawing a horizontal line is not feasible, then both lines of the triangle need to be symmetrical. They should create an equilateral triangle.
- If a horizontal line or an equilateral triangle cannot be constructed, this suggests another price pattern, such as a wedge or a flag.
Types of Triangle Patterns in Stock Market Patterns
Triangle patterns belong to the category of trend patterns.
Types of triangles commonly used in technical analysis include:
- Symmetrical Triangle
- Ascending Triangle
- Descending Triangle
These triangle patterns help traders analyze market sentiment and anticipate potential price movements.
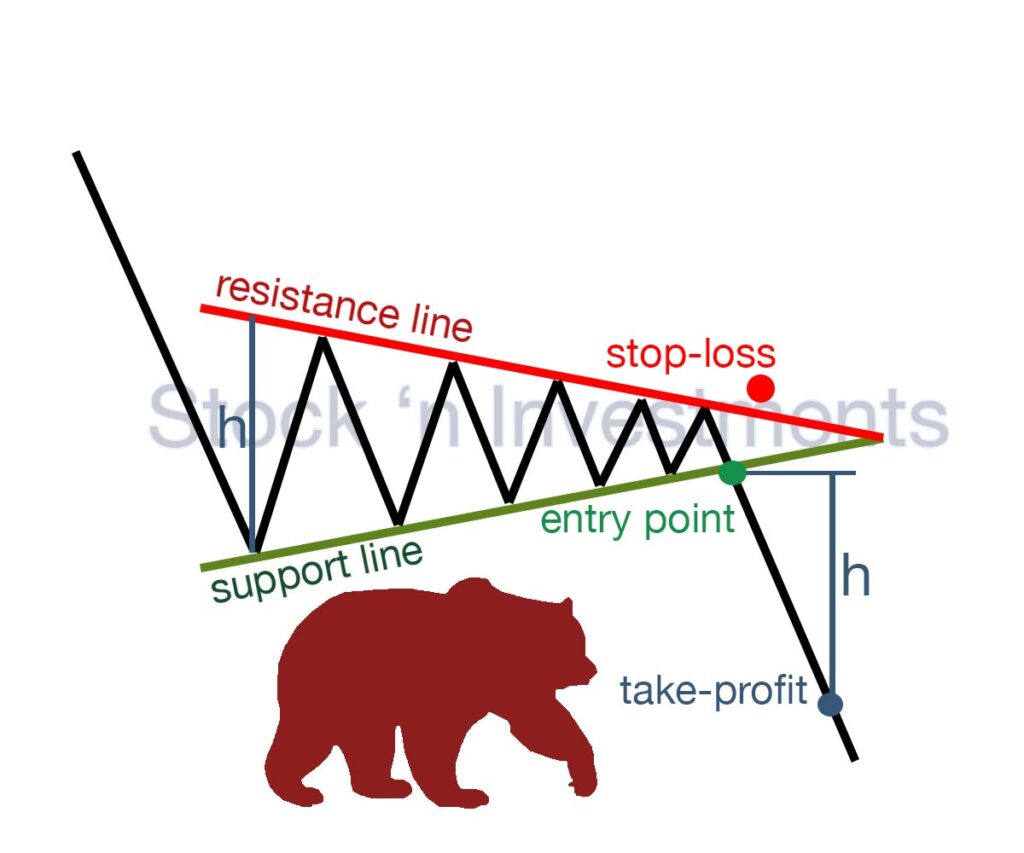
Symmetrical Triangle Pattern in Stock Market Patterns
The symmetrical triangle appears on the chart when the price peaks are lower and the troughs are higher. The symmetrical triangle is defined by both sides inclined at identical angles. Generally, it signifies uncertainty regarding the breakout direction, given that both bullish and bearish movements exhibit equal strength. A potential breakout at the upper or lower levels of the triangle can trigger a price move equal to the pattern’s size. Therefore, it is important to carefully identify these levels for timely market entry.
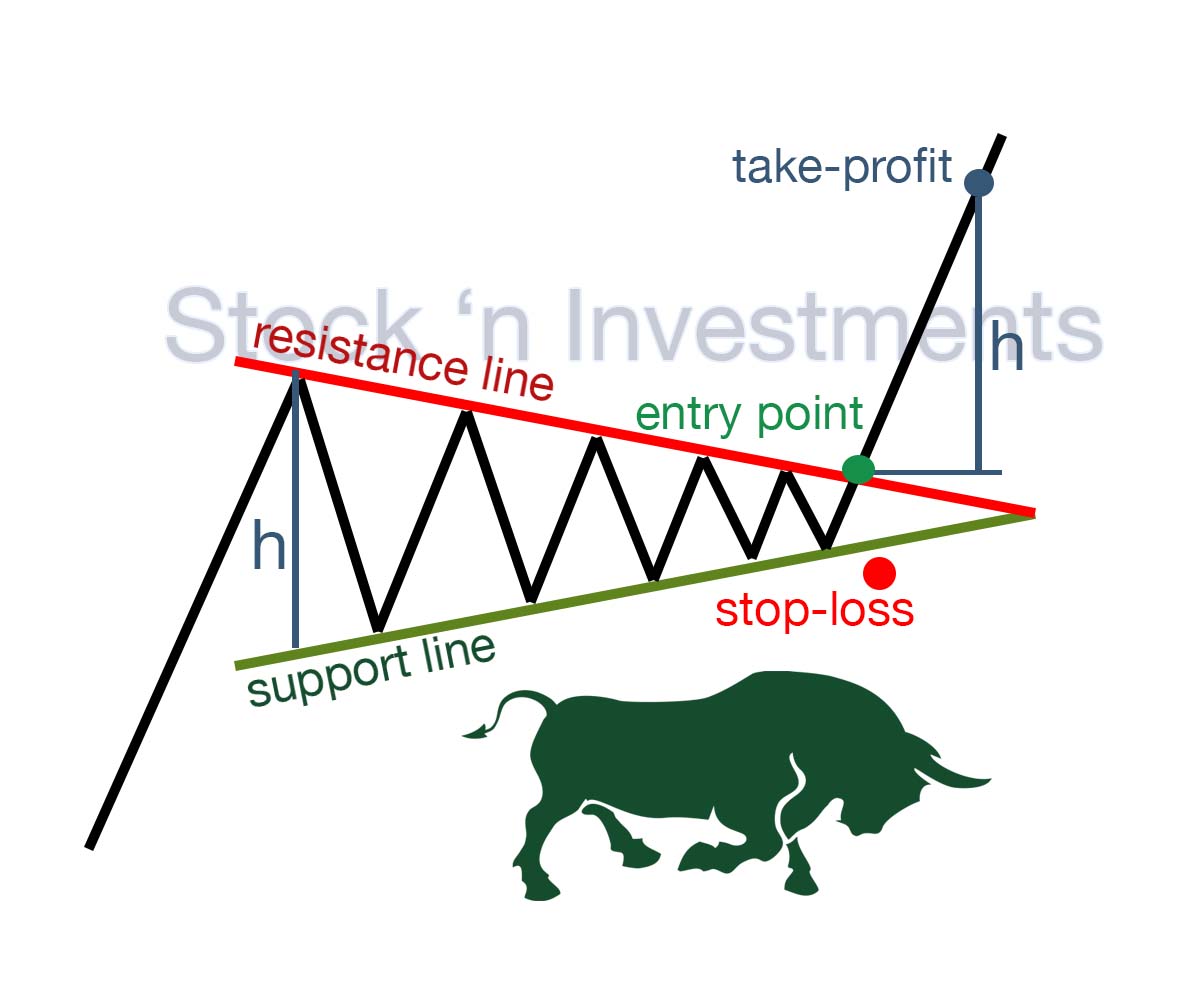
The appearance of a symmetrical triangle on the chart signifies a period of reduced market volatility, indicating an imminent surge in volatility.
How to Identify a Symmetrical Triangle Pattern?
- Both sides of the triangle are symmetrical.
- The triangle has decreasing highs and increasing lows.
- It resembles a funnel, with the price squeezing from both sides.
- Price compression cannot continue indefinitely. Sooner or later, it will break out of the triangle boundaries, providing an entry point in the market.
Symmetrical triangles take time to form on the chart, often spanning several months when trading daily charts. If you notice a triangle forming over a few weeks or days, it’s likely not a symmetrical triangle but possibly another trend continuation pattern, such as a flag.
Symmetrical Triangle Pattern: Trader’s Mistakes
One common error traders commit when dealing with a symmetrical triangle is trying to follow the price immediately after it breaks out.
As the buying momentum diminishes, the price reaches a point where it cannot sustain upward movement. This prompts smart investors to take their profits and start closing their positions. Concurrently, bearish traders seize the opportunity to open short positions, leading to a shift in market sentiment.
Traders who entered the market at its peaks find themselves facing losses and eventually opt to exit their positions at predefined stop-loss levels. This further exacerbates the downward pressure on the price.
Ascending Triangle Pattern in Stock Market Patterns
The ascending triangle is a typical form of a graphical pattern indicating a potential bullish trend in prices. It can be identified by the presence of a flat upper side, while the lower side is sloping. In this pattern, the peaks are at the same level, while the bases rise to the upper boundary. It often signals price increases, and traders may anticipate further upward movement.
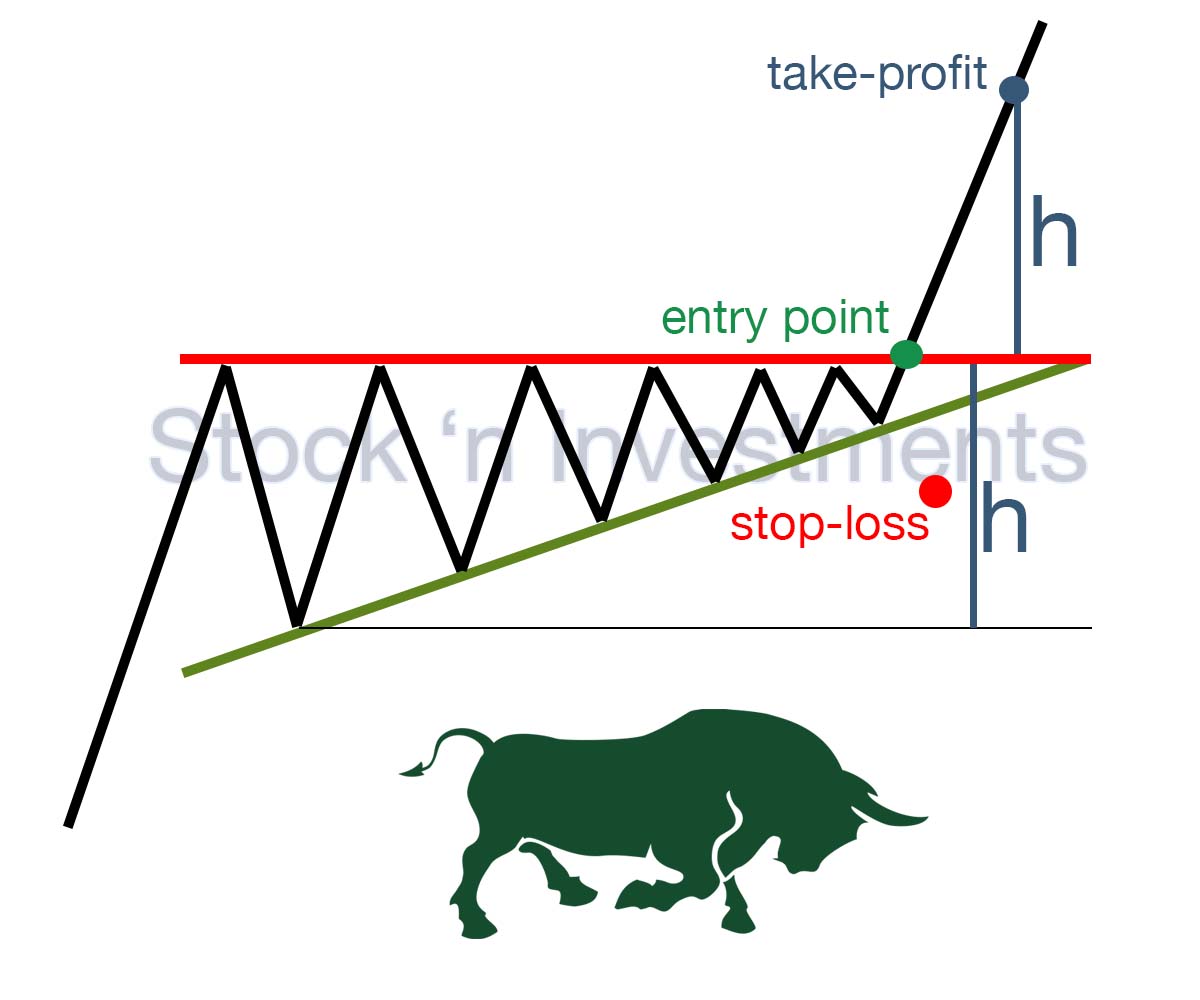
Visually, the ascending triangle is identified by a series of increasing lows that converge toward the resistance line. This indicates active demand as buyers are willing to purchase at higher prices, and there is little significant selling pressure from sellers. When the price nears the resistance level, continued growth can be anticipated. This is because new traders witnessing the breakout may initiate positions, and buy stop orders positioned below the resistance level strengthen the trend. A breakout beyond the resistance level can fuel even stronger upward momentum, as stop orders from short positions are activated, driving the price upwards.
Descending Triangle Pattern in Stock Market Patterns
The descending triangle is a pattern that may indicate a potential decline in prices in the market. It is a mirror image of the ascending triangle. In a descending triangle, the flat side is positioned lower than in the ascending triangle, and the upper side slopes downward. This pattern often accompanies a bearish trend, indicating that sellers are in control.
Typically, when prices decrease, demand increases, pushing prices higher. However, this does not apply to the descending triangle. Here, when prices fall, demand is absent, and sellers are willing to sell at even lower prices, leading to a series of lower highs. Additionally, stop orders are formed below the support level as traders buy from this level. The more of these stop orders, the more pressure on the price, especially if the market breaks below the support level.
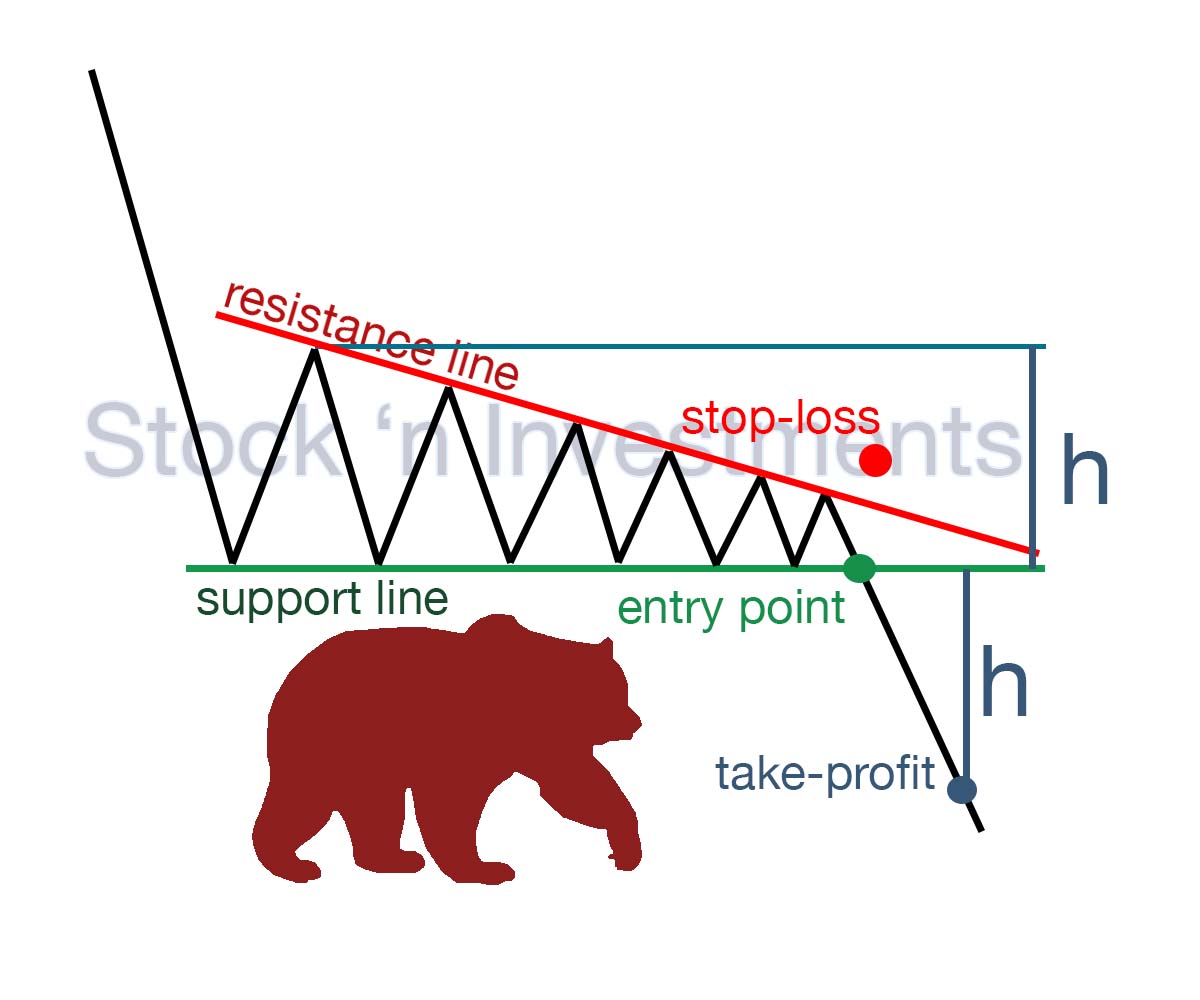
In stock market patterns, it is usually recommended to open short positions at resistance levels. However, when analyzing a triangle pattern, it is important to pay attention to how the price approaches the level. The more frequently the price tests the level, the higher the probability of a breakout. Each test attracts new sellers and increases the number of stop orders placed above the resistance level. When a breakout happens, these stop losses will be activated, amplifying the downward momentum of the price. Another factor that reinforces the breakout of the level is low price volatility.
Analytics
How to Improve Your Results in Trading Triangle Patterns?
One of the first and crucial things is choosing the timeframes you will work with. It is significant to avoid low timeframes and intraday noise that can arise from minor news events or random price fluctuations. On longer timeframes, false breakouts occur much less frequently.
This will give you more time to make trading decisions, reduce stress, and help you find the optimal entry point into the market and set profit targets.
It’s also worth reducing the number of trades. If you trade on daily timeframes and make more than ten trades per month, there is a high probability that you are trading too frequently. It’s important to select quality over quantity. The best entry points will always be rare.
Before adding the symmetrical triangle to your trading arsenal, you need to be patient. Don’t expect this pattern to appear every week or even every month. However, with the right risk-to-reward ratio, potential income can justify your expectations.
It’s essential to constantly track your results, both positive and negative. Keeping a trading journal is a crucial step for a successful trader, as it helps identify mistakes and avoid them in the future.
What do you need to know to make informed decisions in trading?
To make accurate and informed decisions, you need to conduct fundamental analysis of the asset, which includes studying the economy and legislation of the country where the asset is located, as well as analyzing the asset itself. Additionally, to make sound decisions, you need to perform technical analysis, which involves identifying patterns on charts and making decisions based on them.
What does the triangle pattern indicate?
Triangle patterns are often considered continuation patterns because they typically occur within an ongoing trend and suggest that the market is taking a breather before continuing in the same direction as the prevailing trend.
How to determine the entry point into a position using the triangle pattern?
Since the triangle pattern has three types, it’s worth considering each type separately. In an ascending triangle, traders typically wait for a breakout above the resistance line, which signals a buying opportunity as the price is rising. If a descending triangle: one should wait for a breakout below the support line, which signals selling the asset as the price is falling. In a symmetrical triangle, it’s a bit more complicated. Usually, if the price breaks above the resistance line, it’s a signal that the price will rise even higher, and if the price breaks below the support line, it means that the price decline will continue.
It’s also important to observe the trading volume during the breakout of the lines. If the buying volume starts to significantly increase, then one should expect a breakout above the resistance line. Conversely, if the selling volume significantly increases, then one should expect a breakout below the support line.
Pingback: Stock Market Patterns Bulls & Bears
Pingback: Stock Market Patterns, 12 options Stock 'n Investments
Pingback: Falling Wedge Pattern: Simple and Clear - Stock 'n Investments
Pingback: Symmetrical Triangle Pattern - Stock 'n Investments
Pingback: The Significance of Using Stock Technical Indicators for Trading - Stock 'n Investments