The main idea of the descending triangle pattern is that this technical analysis pattern signals a potential downward price breakout. A descending triangle forms when the price of an asset creates a series of lower highs, forming a descending trend line, while the lows remain roughly at the same level, forming a horizontal support line. This is one of the stock market patterns.
The main elements of the descending triangle pattern
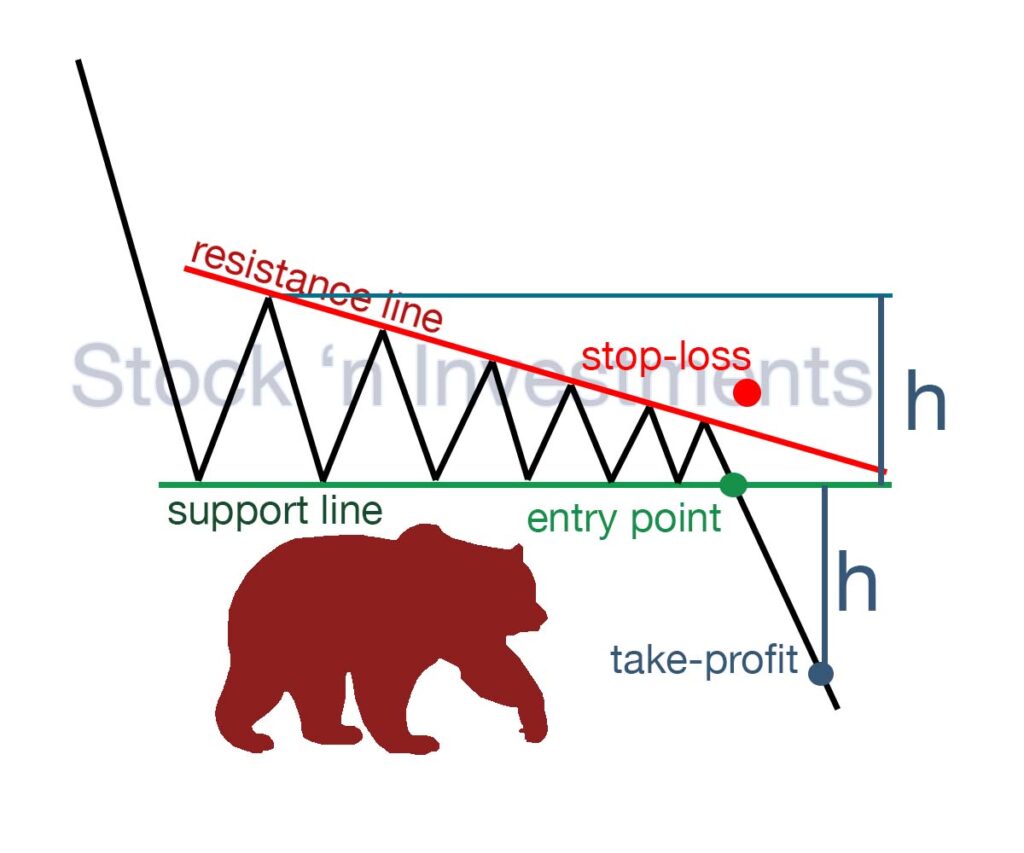
Downward trend line. A line connecting a series of lower highs. These peak points decrease in value, indicating increasing selling pressure.
Horizontal support line. A line connecting the lows that remain at the same level. This support line indicates that buyers are entering the market at this level, preventing further price decline.
Volume. Typically, trading volume decreases as the pattern forms. A significant increase in volume during the breakout below the support line confirms the reliability of the signal.
Breakout. The breakout usually occurs downward, below the support line, signaling a potential further decline in price.
These elements together create the descending triangle pattern, which traders use to predict a potential downward price movement.
Key stages of formation
Consolidation period. The price fluctuates between the horizontal support line and the downward resistance line.
Price compression. As the apex of the descending triangle approaches, the price compresses as sellers and buyers compete for control.
Breakdown. The critical moment when the price breaks below the horizontal support line, usually accompanied by an increase in trading volume.
The use of the descending triangle pattern in trading
Market entry. Traders usually wait for confirmation of a breakout through the support level on high volume to enter a short position.
Stop-loss. A stop-loss can be set above the last high or above the descending resistance line to protect against potential losses in case of a false breakout.
Target price. The target price can be set using the height of the descending triangle. This is done by subtracting the height of the triangle from the breakout level.
What is the essence of the descending triangle pattern?
Technical traders use the descending triangle as an indicator that the trend is likely to continue its downward movement after breaking through the support level. After such a breakout, traders often open short positions (sell), expecting further price decline.
Are there differences in the effectiveness of the descending triangle formation across different markets (e.g., stock, currency, commodity)?
Yes, the effectiveness of the descending triangle formation can vary across different markets due to their unique characteristics. Here are a few differences:
Stock market. In the stock market, the descending triangle can be quite effective, especially if there are sufficiently large volumes during the breakout. However, some stocks may be less predictable due to the influence of fundamental factors.
Currency market. In the currency market, the effectiveness of the descending triangle can also be high, but it may be influenced by important economic news or geopolitical events.
Commodity markets. In commodity markets such as oil or gold, the effectiveness of the descending triangle may be limited due to high price volatility and the influence of fundamental factors such as changes in production or demand.
Additionally, it’s important to consider the time horizon of trading, the level of market liquidity, and other factors when assessing the effectiveness of the descending triangle pattern in a specific market.
How does the duration of the consolidation period affect the reliability of the downward breakout signal through the horizontal support line?
The duration of the consolidation period in the descending triangle pattern can affect the reliability of the downward breakout signal through the horizontal support line. Here’s how it can happen:
Long consolidation. If the consolidation period lasts long, it may indicate an accumulation of selling pressure. A prolonged consolidation can create more potential energy for price movement, and a breakout through the horizontal support line under such conditions may be a more reliable signal.
Short consolidation. In some cases, a short consolidation period can also signal a reliable breakout. This can occur, for example, when there is a large cluster of sales in the market, which immediately leads to a breakout after a short consolidation period.
Volume. Regardless of the duration of consolidation, it’s also important to pay attention to trading volume. Increased volume during the breakout can confirm its reliability.
In any case, traders are advised to use confirming signals and consider other factors, such as market context and overall price dynamics, for a more accurate assessment of the breakout signal’s reliability.
Are there ways to determine the extent of the move after breaking through the lower support line that additionally confirm the forecasted target price?
Yes, there are several ways to determine the target price after a breakout through the lower support line in the descending triangle pattern that can further confirm the forecasted target price:
Triangle height. A traditional method involves measuring the height of the triangle from the highest point to the horizontal support line. This height can then be used to determine the target price after the breakout.
Projection from the breakout. Another method is to use the principle of projection from the breakout moment. After the breakout of the triangle, the breakout move and its projection to the level corresponding to the triangle’s height can be identified. This point can serve as the target price.
Fibonacci extensions. Some traders also use Fibonacci levels to determine target prices after a breakout. Typically, they are set at the height of the triangle and can serve as potential support or resistance levels.
How does the reliability of the descending triangle pattern signal vary depending on the trading volume?
Large volume on breakout. If the breakout through the lower support line occurs on a large trading volume, it can confirm the reliability of the signal. A high trading volume during the breakout indicates active market participation and support for the price movement.
Low volume during consolidation. If trading volume decreases during the consolidation period before the breakout, it may signal that the market is preparing for a move. However, it’s important to note that low volume may also indicate low interest in the asset, increasing the risk of a false breakout.
Change in volume during breakout. A significant increase in volume during the breakout confirms its reliability. However, if the volume remains low during the breakout, it may indicate insufficient market participation and an increased risk of a false breakout.
Can fundamental factors or events affect the effectiveness of the descending triangle pattern?
Yes, fundamental factors and events can influence the effectiveness of the descending triangle formation.
Economic reports and news. Important economic reports or news can impact price activity and lead to unpredictable price movements, which can change the effectiveness of the descending triangle formation.
Geopolitical events. For instance, geopolitical conflicts or geopolitical instability can create market uncertainty and result in unexpected price movements, which can alter the behavior of price activity relative to the descending triangle pattern.
Financial events and regulations. For example, announcements of financial results of companies or changes in legislation can affect price activity and change the effectiveness of the pattern.
Seasonal factors. In some cases, seasonal factors can influence price activity patterns, such as the descending triangle shape.
What are the main risk analysis methods used to mitigate potential losses in the event of a false breakout or failure of the descending triangle pattern?
Setting Stop-loss Orders. Placing stop-loss orders at levels above important support points can help limit losses in case the pattern fails.
Using Alternative Patterns. Technical traders often utilize alternative patterns or confirming signals along with the descending triangle to confirm the anticipated price movement and reduce risk.
Analyzing Trading Volume. Considering trading volume during the breakout can help determine the reliability of the signal. Low volume during the breakout may indicate its low reliability.
Confirmation with Fundamental Analysis. Fundamental analysis can be used to confirm technical signals, ensuring there are no fundamental factors that could lead to the failure of the pattern.
Risk Management and Position Sizing. Properly managing risks and position sizes is crucial to reduce potential losses in the event of a false breakout or failure of the pattern.
How different price movements before the beginning of the descending triangle pattern can affect its forecasted effectiveness?
Different price movements before the start of the descending triangle formation can impact its forecasted effectiveness.
Trend direction. If the descending triangle chart occurs after a prolonged uptrend, its signal may be stronger as it could indicate a potential transition from a bull to a bear market. On the other hand, if the descending triangle arises after a prolonged downtrend, its signal may be less reliable as the market is already in a bearish state.
Trading volume. Increasing trading volume during the formation of the descending triangle can reinforce its signal. High volume confirms market interest in the breakout and increases the probability of a successful continuation of the price movement downwards after the breakout.
Duration of consolidation priod. The longer the price stays in consolidation before the beginning of the descending triangle chart pattern, the stronger its signal may be. The duration of consolidation indicates increasing psychological pressure between bulls and bears, and when this pressure manifests, it can lead to a significant downward price movement.
Price movement shape before the triangle. If aggressive downward movement or a rapid reversal occurs before the descending triangle formation, it may increase the likelihood of a successful breakout through the lower support line.
Pingback: Triangle Patterns: Understanding & Analytics - Stock 'n Investments