The inverse cup and handle pattern is a bearish reversal pattern, indicating a potential decline in price following a brief consolidation period. It is called an inverted cup and handle or upside-down cup and handle, and it is one of the stock market patterns.
Steps for trading the inverse cup and handle pattern
Identify the pattern
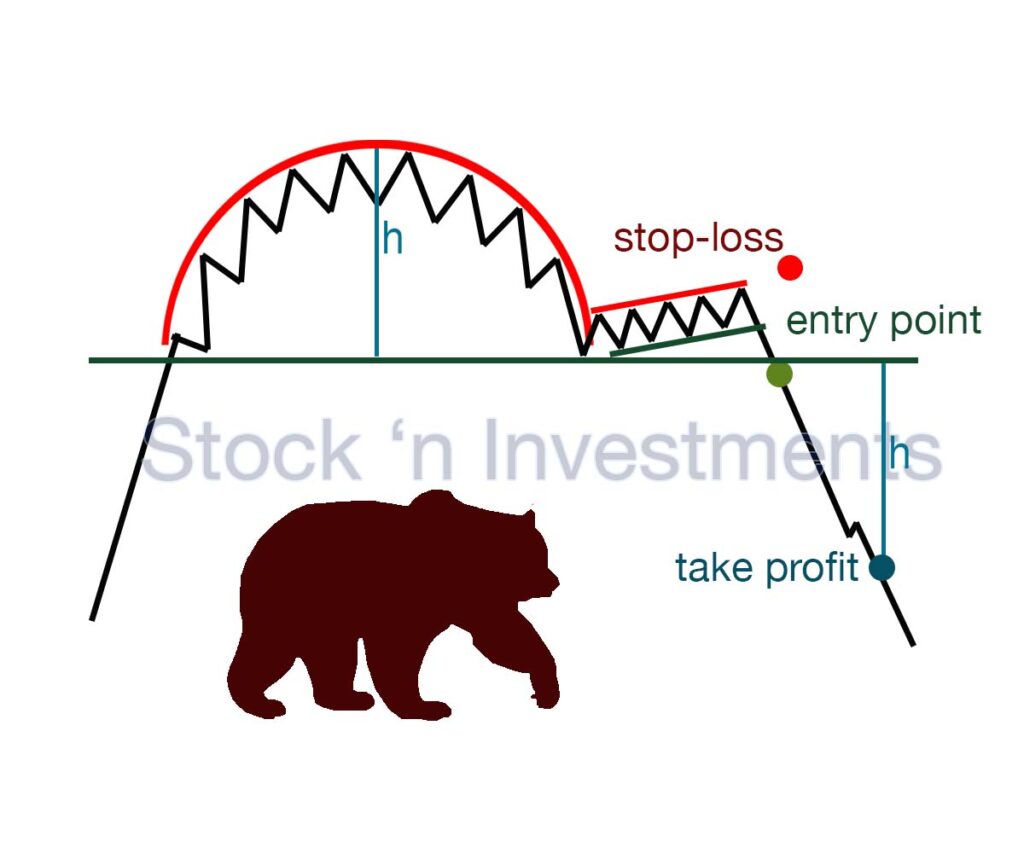
Identify the rounded top that resembles an upside-down cup. The price should rise, reach a peak, and then start to decline, forming an “inverted U” shape. After forming the inverse cup, the price consolidates or slightly rises, forming the handle. The handle is usually a small sideways or slightly upward movement.
Confirm the pattern
Check the trading volumes. Volumes should decrease during the formation of the cup and handle, and then increase during the breakdown below the support level.
Breakout of the inverse cup and handle pattern
The breakout in the cup and handle pattern is a critical point where the price moves above the resistance level, indicating a potential continuation of the uptrend.
Set entry point
Place a sell order just below the support level formed by the bottom of the inverted cup. This confirms the continuation of the downtrend.
Set stop-loss
We have two types of stop-loss of the inverse cup and handle.
- Conservative stop-loss. Place a stop-loss slightly above the top of the handle.
- Aggressive stop-loss. Place a stop-loss slightly above the top of the inverted cup.
Set take profit for the inverse cup and handle
Measure the height of the inverse cup (from the top to the bottom) and project this distance downward from the breakdown point to set the profit target.
Volume analysis in the inverse cup and handle pattern
Formation of the inverted cup
As the price rises to form the left side of the inverted cup, there is typically an increase in volume, indicating strong buying interest. When the price reaches the peak and starts to decline, volume often decreases, suggesting weakening buying pressure and the start of distribution.
Formation of the handle
As the price consolidates or slightly retraces upward to form the handle, the volume usually remains low. This indicates a lack of strong buying interest and suggests that the upward movement is weak and temporary in the inverse cup and handle pattern.
Breakdown Confirmation
The most critical volume signal is during the breakdown below the support level formed by the bottom of the inverted cup. A significant increase in volume at this point confirms the bearish breakout and the continuation of the downtrend. Continued high volume after the breakdown indicates strong selling pressure and increases the likelihood that the downtrend will persist.
Why is this inverse cup and handle pattern considered a reversal pattern?
The pattern is considered a reversal pattern because it signals a change in trend direction from bullish to bearish. Initially, the price rises, forming an inverted cup, then slightly increases, creating a handle. When the price breaks below the support level and trading volumes increase, it confirms the start of a downtrend, indicating a market reversal.
Why is this pattern called bearish?
The inverse cup and handle pattern is called bearish because it signals an upcoming price decline. After forming a rounded top resembling an inverted cup, the price slightly increases, creating a handle. A breakout below the support level, confirmed by rising trading volume, indicates a continuation of the downtrend. This pattern signals traders to consider selling or entering a short position.
What technical indicators are used for trading the inverse cup and handle pattern?
- Volume. Confirms the strength of the pattern. Volume typically decreases during the formation of the cup and handle and significantly increases during the breakdown below the support level.
- Relative Strength Index (RSI). Indicates overbought or oversold conditions.
- Bollinger Bands. Measure market volatility and potential support and resistance zones.
- Moving Averages. Indicate trend direction and potential support and resistance levels.
- MACD (Moving Average Convergence Divergence). Indicates changes in the strength, direction, momentum, and duration of a trend.
- ADX (Average Directional Index). Measures the strength of a trend.
Tips
- Use a combination of indicators for more reliable signal confirmation in the inverse cup and handle.
- Do not make decisions based on a single indicator; consider the overall market picture.
- Conduct thorough analysis and backtesting of the chosen indicators on historical data to improve prediction accuracy.
Is it appropriate to use a trailing stop when trading the inverse cup and handle pattern?
Yes, using a trailing stop can be appropriate when trading patterns, including various chart patterns like cup and handle, head and shoulders, triangles, etc. A trailing stop helps lock in profits as the price moves favorably in your direction. It adjusts automatically based on market movements, allowing you to secure gains while letting profits run. However, the effectiveness of a trailing stop depends on market conditions, volatility, and the specific characteristics of the pattern being traded. Adjusting the trailing stop distance based on these factors can optimize its usefulness in pattern trading.
Which timeframe is best to use when trading the pattern?
The choice of a specific timeframe also depends on your trading style, the duration of your trades (short-term or long-term), and your ability to actively manage positions. When choosing a timeframe for trading the inverse cup and handle pattern, it’s best to use timeframes ranging from 1-hour to daily and even weekly.
1-hour and 4-hour timeframes. These timeframes can provide enough detail to identify pattern formation and sufficient perspective for entering and managing trades.
Daily and weekly timeframes. These offer a broader view of the trend and can be useful for identifying significant price movements and confirming patterns on longer-term charts.
In conclusion
The inverse cup and handle meaning refers to a technical analysis pattern that indicates a potential reversal in an upward trend, typically signaling a bearish market movement when the price breaks below the support level formed by the handle.