Triangle pattern trading: why 4 formations and not 3? These patterns are popular chart patterns in technical analysis that can indicate the continuation or reversal of a trend. There are three main types of triangle patterns: ascending, descending, and symmetrical. A symmetrical triangle comes in two types: bullish and bearish. All these patterns belong to stock market patterns. Each type provides different trading opportunities.
Ascending triangle pattern trading
Imagine that the stock of company ABC is trading at $50. Over the next few weeks, the price rises to $55 and then retreats to $52, forming a support line at $52. The price then rises again to $55, but doesn’t exceed this level and retreats again, creating a series of lows at $52. This forms an ascending triangle with a resistance line at $55 and a support line rising from $52.
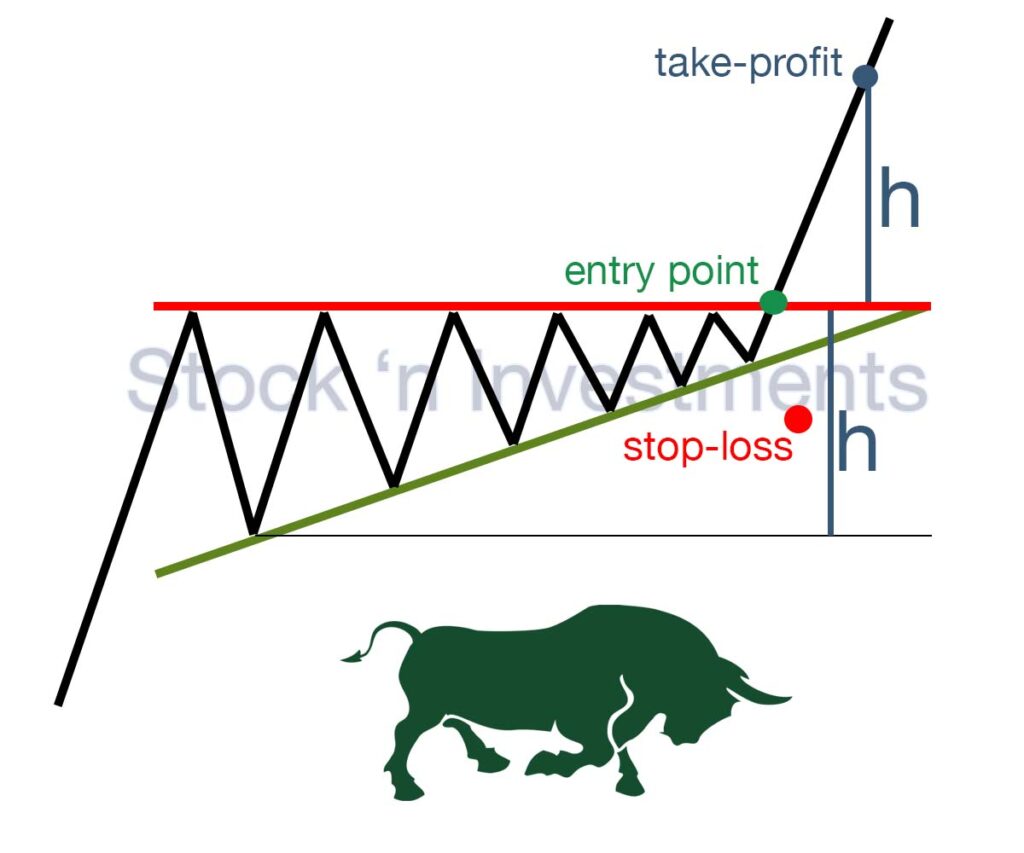
Entry point. Traders often enter a position when the price breaks above the resistance line ($55) on high volume. This confirms the strength of the pattern.
Stop-loss. Place a stop-loss slightly below the last low, for example, at $53, to limit potential losses in case of a false breakout in triangle pattern trading.
Take-profit. The profit target can be set at a level equal to the height of the triangle. In this case, the height of the triangle is the difference between the resistance level ($55) and the lowest level ($50), which is $5.
Thus, the trader opens a position at $55, sets a stop-loss at $53, and a take-profit at $60, monitoring the pattern development and adjusting their positions as necessary.
Descending triangle pattern trading
Let’s consider the stock of the company ABC, currently trading at $100. Over the next few weeks, the price repeatedly falls to $95 but fails to drop lower, creating a horizontal support line at $95. Meanwhile, the highs gradually decrease from $105 to $100, forming a downward-sloping resistance line.
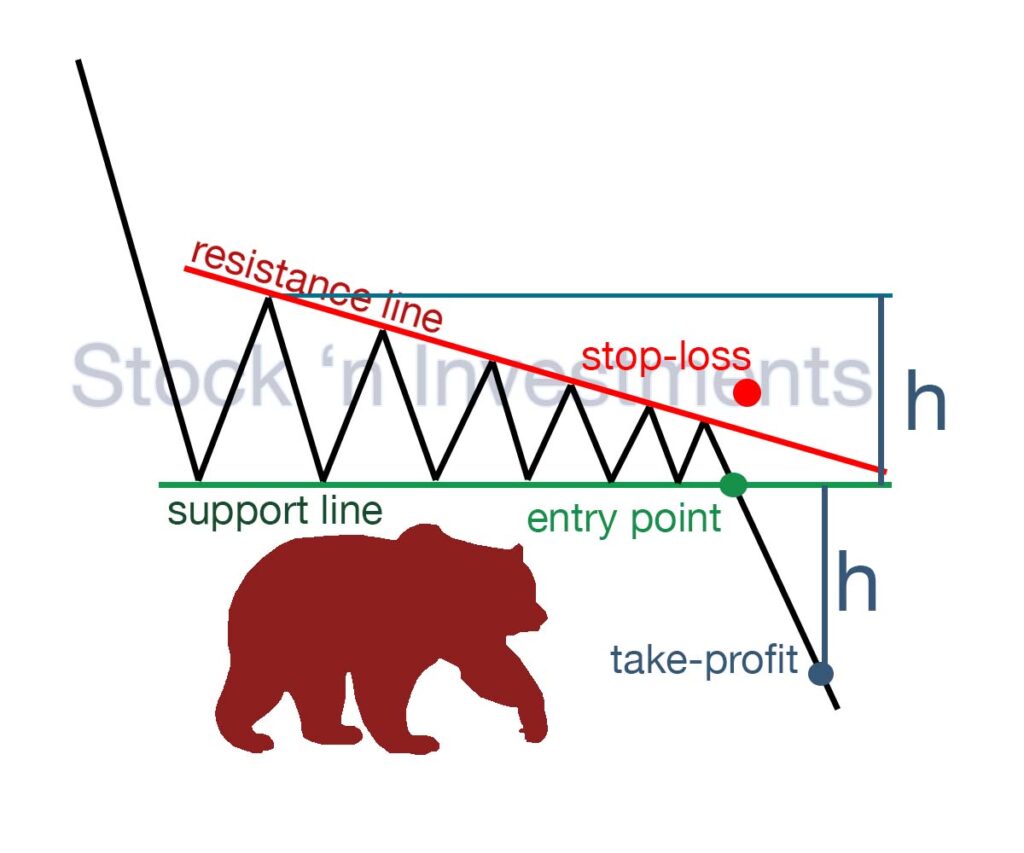
Entry point. Traders typically enter a short position when the price breaks below the support line ($95) on high volume. This indicates a strong likelihood that the price will continue to decline.
Stop-loss. Place a stop-loss slightly above the last high before the breakout, for example, at $98 or $99, to limit potential losses in case of a false breakdown in triangle pattern trading.
Take-profit. The profit target can be set at a level equal to the height of the triangle. In this case, the height of the triangle is the difference between the initial high ($105) and the support level ($95), which is $10.
Thus, the trader opens a short position at $95, sets a stop-loss at $99, and a take-profit at $85, monitoring the pattern development and adjusting their positions as necessary.
Symmetrical triangle pattern trading
It consists from bullish and bearish symmetrical patterns.
Bullish symmetrical triangle pattern
Let’s take a practical example of trading the bullish symmetrical triangle pattern. Suppose we’re looking at ABC Corp, which is currently trading at $100 and is in an uptrend. Over a few weeks, you notice that the stock is forming higher lows, with the price dipping to $98, then $99, and then $99.5. At the same time, it’s forming lower highs, peaking at $102, $101, and $100.5. This price action converges, creating a symmetrical triangle.
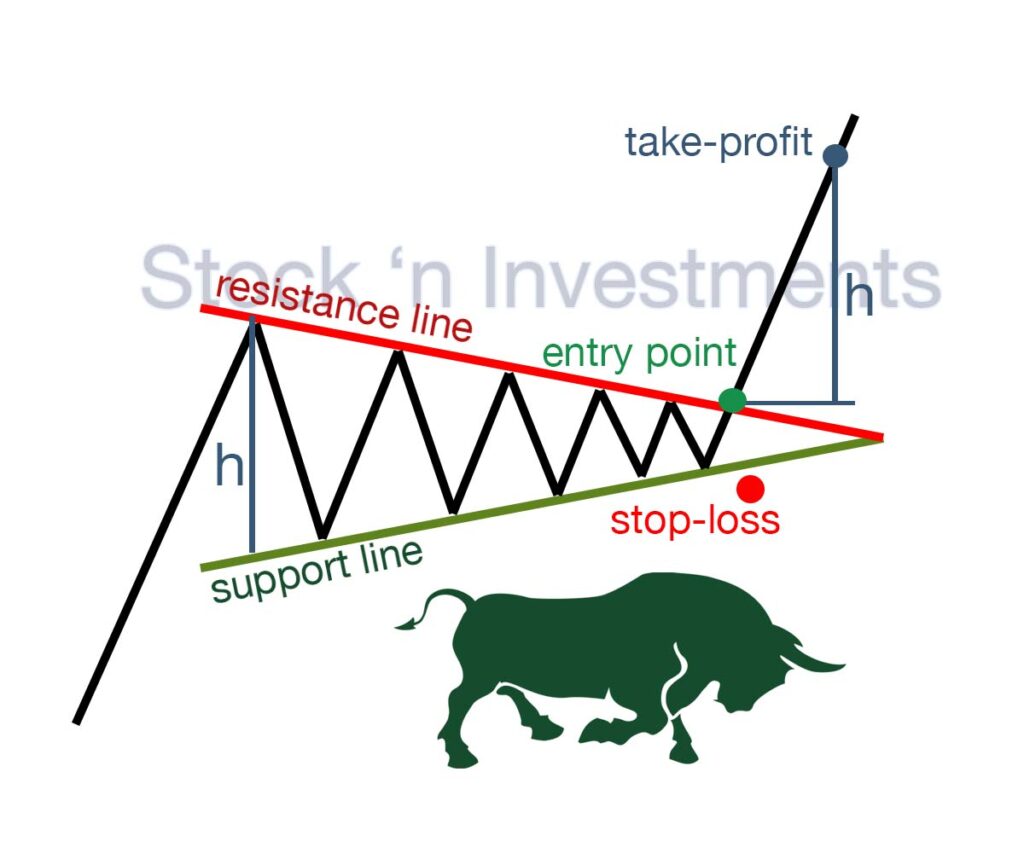
Entry point. To confirm a breakout, wait until the stock price breaks above the upper trend line of the triangle with increased trading volume. For instance, if the price breaks above $100.5, you might decide to enter a long position at $101.
Stop-loss. To manage your risk, set the stop-loss just below the last higher low within the triangle. If the last higher low was at $99.5, you’d place the stop-loss at $99.
Taking profit. Calculate your profit target by measuring the height of the triangle at its widest part and adding it to the breakout point in triangle pattern trading. If the height of the triangle is $4 (from $98 to $102) and the breakout happens at $101, your target price would be $105 ($101 + $4).
Bearish symmetrical triangle pattern
Suppose we’re analyzing ABC Corp, which is currently trading at $80 and has been experiencing a downtrend. Over several weeks, you observe that the stock is forming lower highs, reaching peaks at $82, $81.5, and $81. At the same time, it’s creating higher lows, with the price bouncing off support levels at $78, $79, and $79.5. This price action converges, forming a symmetrical triangle pattern.
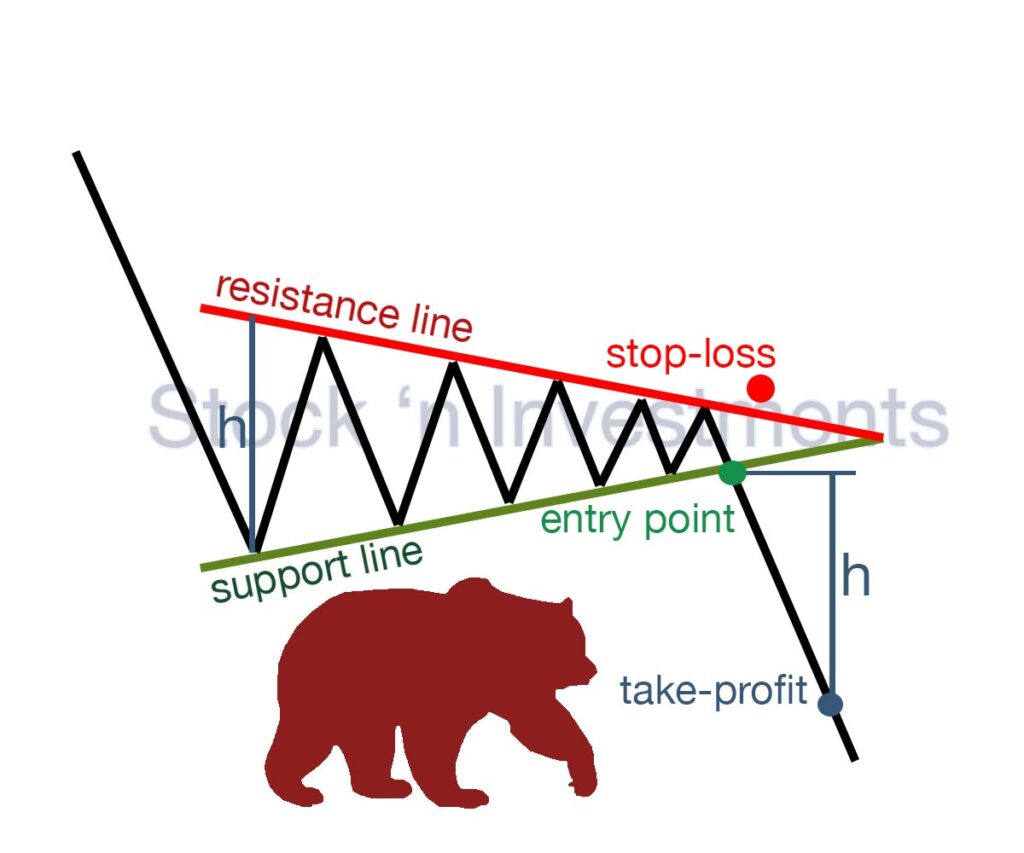
Entry point. Wait for confirmation of a breakdown below the lower trend line of the triangle with increased trading volume. For instance, if the price breaks below $79, you might decide to enter a short position at $78.5.
Stop-loss. To manage risk, set the stop-loss just above the last lower high within the triangle. If the last lower high was at $81, you would place the stop-loss at $81.5 to protect against a potential reversal.
Taking profit. Calculate your profit target by measuring the height of the triangle at its widest part and subtracting it from the breakdown point in triangle pattern trading. If the height of the triangle is $4 (from $82 to $78) and the breakdown happens at $78.5, your target price would be $74.5 ($78.5 – $4).
Key technical indicators for all triangle patterns
- Volume
- Moving Averages
- Relative Strength Index (RSI)
- On-Balance Volume (OBV)
- MACD (Moving Average Convergence Divergence)
- Average True Range (ATR)
- Bollinger Bands
- Stochastic Oscillator
What is the success rate of triangle pattern trading in stock markets?
While specific success rate statistics can be hard to pinpoint and can vary from trader to trader, triangle patterns are generally considered reliable tools in technical analysis when used correctly. Studies and trader experiences suggest that success rates for well-formed and correctly traded triangle patterns can range between 60% to 80%. However, it’s important to note that no pattern guarantees success, and effective risk management strategies are crucial to mitigate potential losses.
What are common mistakes to avoid?
When trading triangle patterns, it’s important to avoid common mistakes:
- ignoring volume in triangle pattern trading
- entering too early
- poor stop-loss placement
- ignoring market context
- misidentifying patterns
- falling for false breakouts
- incorrect measurements
- lacking a plan
- skipping indicators
- emotional trading
How can one manage risk while engaging?
Managing risk involves several key strategies:
- Place stop-loss orders just outside the triangle pattern to minimize potential losses. For ascending and descending triangles, place the stop-loss below or above the pattern respectively.
- Determine the size of your trade based on your risk tolerance and the distance between the entry point and the stop-loss level. This helps limit the amount of capital at risk.
- Ensure the breakout is confirmed by a price close beyond the trend line, ideally accompanied by increased volume, before entering a trade.
- Analyze the pattern on different time frames to get a better understanding of the market context and avoid false breakouts.
- Define your profit target based on the height of the triangle pattern and stick to it. This helps in locking in profits and avoiding emotional decision-making in triangle pattern trading.
- Use trailing stop-loss orders to lock in profits as the price moves in your favor. This allows you to capture more of the trend while protecting against reversals.
- Avoid putting all your capital into a single trade. Diversify your trades across different assets and patterns to spread risk.
- Keep an eye on market news and events that could impact price movements. Being informed can help you make better trading decisions and manage risks effectively.
Can triangle pattern trading be effective in all market conditions?
It can be effective in various market conditions, but its effectiveness can vary depending on the specific market environment.
Trending markets. Triangle patterns, especially symmetrical and ascending triangles, often perform well in trending markets. In uptrends, ascending triangles are particularly effective, while in downtrends, descending triangles are more reliable.
Volatile markets. In highly volatile markets, triangle patterns can lead to more frequent false breakouts. Traders should be cautious and look for confirmation with volume or other technical indicators before entering trades.
Sideways markets. Symmetrical triangles can sometimes appear in sideways markets, but their breakouts might not be as significant or reliable. In such conditions, the patterns can lead to choppy price action and less predictable outcomes.
High-liquidity markets. Triangle patterns tend to be more reliable in high-liquidity markets, where large volumes of trades help confirm breakouts. Low-liquidity markets might produce more false signals.
Economic events. Major economic events or news can impact the effectiveness of triangle patterns. Sudden news can cause sharp price movements that might invalidate existing patterns or create false breakouts in triangle pattern trading.