Tag Archives: ascending triangle pattern

The Ascending Triangle Pattern is a bullish continuation chart pattern used in technical analysis. It is characterized by a horizontal resistance line at the top and an upward-sloping trend line at the bottom, forming a triangle shape. This pattern suggests that the price is likely to break out to the upside after a period of consolidation.

Triangle Pattern Trading: Examples and Advice for 4 Patterns

By | June 18, 2024

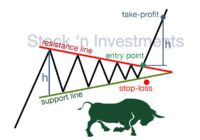
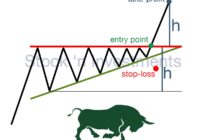
Triangle pattern trading: why 4 formations and not 3? These patterns are popular chart patterns in technical analysis that can indicate the continuation or reversal of a trend. There are three main types of triangle patterns: ascending, descending, and symmetrical. A symmetrical triangle comes in two types: bullish and bearish. All these patterns belong to… Read More »

Ascending Triangle Pattern: Technical Analysis

By | July 13, 2024

This is one of the stock market patterns. The importance of the ascending triangle pattern lies in its ability to serve as a signal for trend continuation. When the price approaches the upper horizontal line (resistance) and forms higher lows, it may indicate increasing demand and an attempt by the market to overcome resistance. Traders… Read More »

Triangle Patterns: Understanding & Analytics

By | July 16, 2024

Embarking on the exploration of triangle patterns suggests you’re an aspiring trader, eager for knowledge. You’re on the right path. Mastering technical analysis patterns is crucial for trading success. By the end of this article, you’ll have a firm grasp on how to effectively utilize triangle patterns. With vivid diagrams and clear descriptions, consider this… Read More »