This is one of the stock market patterns. The importance of the ascending triangle pattern lies in its ability to serve as a signal for trend continuation. When the price approaches the upper horizontal line (resistance) and forms higher lows, it may indicate increasing demand and an attempt by the market to overcome resistance. Traders use this pattern to identify potential entry points into the market, considering that a breakout to the upside may lead to further price appreciation. Thus, the ability to recognize and analyze the ascending triangle formation enables traders to make informed trading decisions.
Main elements of the ascending triangle pattern
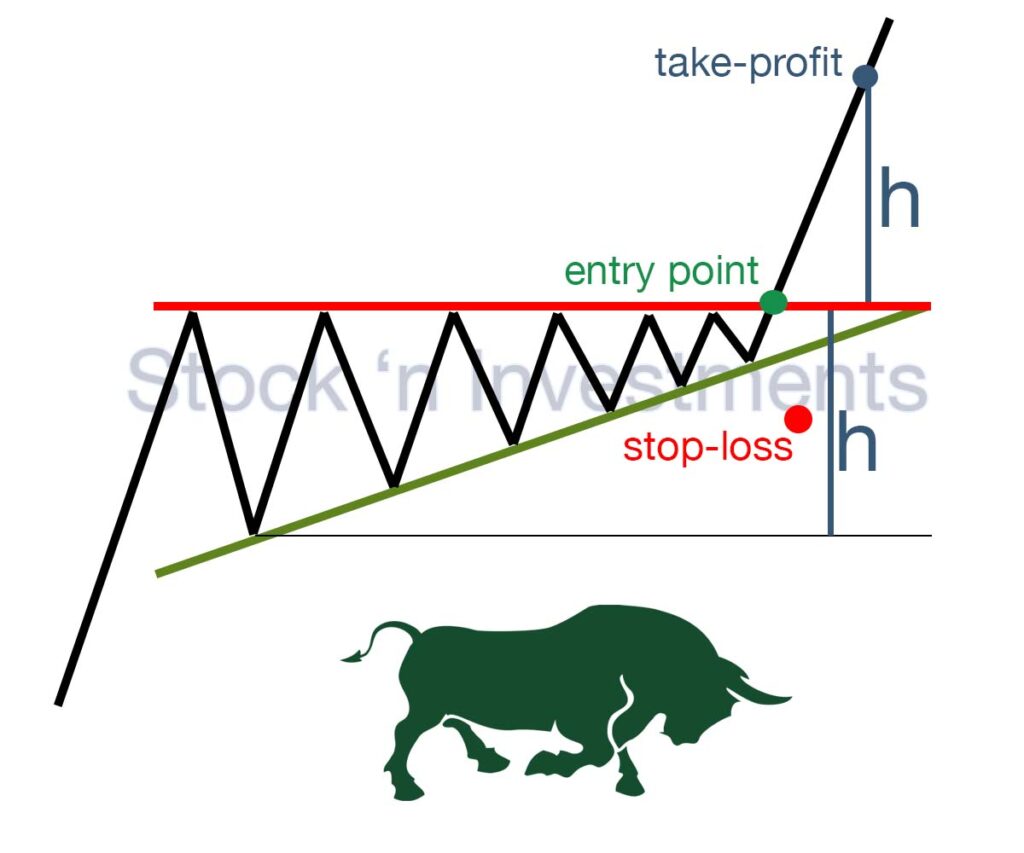
The main elements of the ascending triangle construction are the horizontal resistance line, formed at the top of the pattern, and the upward-sloping support line, which gradually approaches the resistance line from below. Each successive low of the upward-sloping support line is typically higher than the previous one, but prices do not reach the level of the resistance line, creating a consolidation.
The trading volume in an ascending triangle pattern can vary depending on the specific market situation. Typically, trading volumes are observed at the beginning of the formation of the pattern when prices are rising, and trading is active. During the formation of the pattern itself, trading volumes may decrease, indicating reduced market participant activity and price stabilization. However, during the breakout when prices rise, trading volumes may increase again, indicating increased buying activity, which supports further price increases.
Key stages of formation
- Consolidation period: the price fluctuates between the horizontal resistance line and the ascending support line.
- Price compression: as the apex of the triangle approaches, the price compresses as buyers and sellers compete for control.
- Breakout: the pivotal moment when the price breaks through the horizontal resistance line, usually accompanied by an increase in trading volume.
Trading usage ascending triangle chart pattern
- Entry Point: Traders typically wait for confirmation of the breakout above the resistance level with high volume to enter a long position.
- Stop-Loss: A stop-loss can be set below the most recent low or below the ascending support line to protect against potential losses in case of a false breakout.
- Target Price: The target price can be determined by using the height of the triangle. This is done by adding the height of the triangle to the breakout level.
What is the idea behind the ascending triangle formation?
Technical traders use the ascending triangle as an indicator that the trend is likely to continue its upward movement after breaking through the resistance level. After such a breakout, traders often open long positions (buy), expecting further price increases.
Which technical indicators or oscillators are best used in conjunction with the ascending triangle pattern to confirm a potential breakout?
To confirm a potential breakout using an ascending triangle, the following technical indicators and oscillators are best used:
Volume. An increase in volume during the breakout is a key confirmation. If the volume significantly increases, it indicates support for the price movement by major market participants.
Relative Strength Index (RSI). RSI can help determine if an asset is overbought or oversold. If the RSI is in the neutral zone and moves upward during the breakout, it can be an additional confirmation.
Moving Averages. Using moving averages, especially the 50-day and 200-day moving averages, can help confirm the breakout. If the price breaks the resistance line and is above the moving averages, it can be a positive signal.
Moving Average Convergence Divergence (MACD). MACD can indicate a trend change. When the MACD line crosses the signal line from below during the breakout, it can confirm an uptrend.
Stochastic Oscillator. The Stochastic Oscillator can help determine if an asset is in an overbought or oversold zone. If the oscillator is in the neutral zone and moves upward during the breakout, it can support the signal.
Average Directional Index (ADX). ADX helps determine the strength of a trend. If ADX rises and exceeds the level of 20 during the breakout, it can indicate a strong trend.
How does the reliability of the ascending triangle form change depending on the timeframe it forms on (for example, daily chart versus hourly chart)?
The reliability of the ascending triangle pattern can vary depending on the timeframe it forms on because different timeframes may reflect different market aspects and trends. Here’s how it can impact:
Long-term chart (e.g., daily chart). If the ascending triangle forms on a long-term chart like the daily chart, its breakout may have greater significance. Traders may have more confidence in its signal as it may indicate a change in the long-term trend.
Short-term chart (e.g., hourly chart). On a short-term chart like the hourly chart, the ascending triangle may be less reliable. Breakouts on short-term charts can be more vulnerable to false signals or random price fluctuations.
What are the most common mistakes traders make when trading the ascending triangle pattern, and how can they be avoided?
Insufficient volume support. Not all traders pay attention to trading volume during the formation of the pattern. It’s important to consider increasing volume during the breakout, which confirms the strength of the signal.
Ignoring market context. Traders may ignore the overall market trend or important news that could affect the likelihood of a successful breakout.
Entering positions too early. Traders often enter positions before the breakout, which can lead to poor signal accuracy. It’s important to wait for confirmation of the breakout before entering a position.
Lack of risk management preparation. Traders may fail to set stop-loss orders or consider position size relative to the account size.
To avoid these mistakes, traders should:
Carefully analyze trading volume and the overall market context before entering a position in an ascending triangle pattern. Wait for confirmation of the breakout before entering a position and set stop-loss orders to manage risks. Consider important economic events or news that may impact the market.
How does trading volume influence the reliability of an ascending triangle breakout?
Trading volume plays a crucial role in confirming the reliability of an ascending triangle pattern breakout. Generally, increased trading volume during the breakout adds confirmation to the signal and indicates the strength of the price movement. When volume increases during the breakout, it signifies market participants’ activity and support for the price movement.
If the breakout is accompanied by high volume, the probability of a successful move increases. In contrast, low volume may suggest that the breakout is false or unstable.
How to act in case of a false breakout with an ascending triangle pattern?
Wait for confirmation. In the event of a false breakout, it’s important to wait for confirmation of further price movement. Avoid rushing into opening or closing positions.
Review the market context. Assess the overall market context, including other technical indicators and key support and resistance levels. This will help determine whether to trust the breakout and make appropriate decisions.
Set stop-loss orders. Establish stop-loss orders to limit potential losses in case of an unsuccessful breakout. This allows you to preserve capital and avoid significant losses.
Adhere to risk management strategy. Remember to adhere to your risk management strategy and predefined trading rules. Plan your actions in advance and act accordingly.
Analyze and learn. After a false breakout, analyze your actions and results. This can help understand the reasons for failure and improve your trading strategy in the future.
Are there any specific industries or types of assets where pattern works better or worse, and why?
Yes, there are certain industries and types of assets where the ascending triangle pattern may work better or worse due to different fundamental and technical characteristics. Here are some of them:
Stocks of companies with growing fundamental indicators. In the stock market, where companies have strong fundamental indicators and positive outlooks, the pattern may work better. This is because investors may be more interested in these stocks, leading to price support and the formation of ascending triangle patterns.
Currency markets. In currency markets, where trading is done in pairs, the ascending triangle form can also be effective. However, currency markets are often subject to large fluctuations and the influence of fundamental events, which can lead to more false breakouts.
Commodity markets. In commodity markets such as oil or gold, the ascending triangle pattern may have limited effectiveness due to high price volatility and the influence of fundamental factors such as geopolitical events or changes in supply and demand.
Cryptocurrency markets In cryptocurrency markets, where volatility is very high, the ascending triangle formation can work as both a continuation and reversal signal. However, due to rapid price changes, it is difficult to predict the exact timing of a breakout.
How does the value of the ascending triangle pattern change during different phases of the economic cycle?
It is worth noting that the value of pattern can vary depending on the phases of the economic cycle. Let’s consider how this can affect the value of the pattern in different phases:
Downturn Phase (Recession). During this period, the ascending triangle may have less significance because there may be a pessimistic sentiment in the market, and investors may avoid risky positions. Breakouts of the pattern may be less reliable due to the overall decline in prices.
Recovery Phase. During the economic recovery, the ascending triangle formation may become more significant as investors return to the market, seeking growth opportunities. Breakouts of the pattern may indicate a positive market sentiment and potential further development.
Peak Phase (Expansion). During this period, formation may lose its significance as the market approaches maximum levels, and investors may become more cautious. Breakouts may be less reliable due to high levels of saturation.
Decline Phase (Stagnation). During stagnation, chart may regain significance as the market seeks new catalysts for growth. Breakouts may indicate the possibility of restoring positive sentiment in the market.
In each phase of the economic cycle, it is important to analyze the market context and other factors that may affect the value of the ascending triangle pattern. Technical analysis should be complemented by fundamental analysis for a more objective assessment of potential price movements.
Pingback: Triangle Pattern Trading: Examples and Advice for 4 Patterns - Stock 'n Investments
Pingback: Triangle Patterns: Understanding & Analytics - Stock 'n Investments