The importance of the falling wedge pattern lies in its potential to signal a possible change in the price direction. This pattern often occurs during a downtrend and may indicate a weakening bearish market sentiment. When the price enters a falling wedge, it could suggest a reduction in selling pressure and a trend reversal. Therefore, the absence of new lower lows along with increasing volume during the formation of the pattern can confirm its significance to traders.
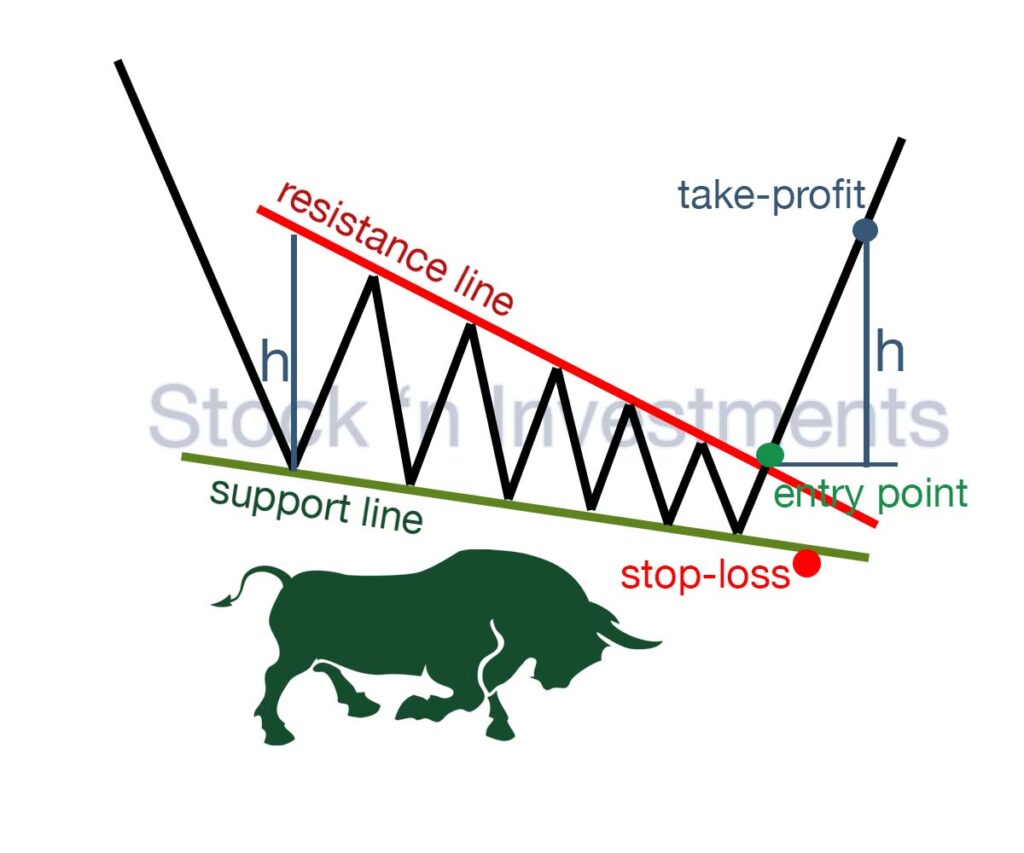
Entry point (breakout)
The entry point of the falling wedge pattern is the moment when the price breaks through the upper resistance line of the wedge formation. This breakout is typically accompanied by an increase in trading volume, indicating a potential shift in market sentiment. Traders typically interpret this breakout as a bullish signal, submitting that the price may continue to rise in the near term. The breakout point also serves as the moment to buy the asset or enter a long position.
Types of stop-loss
Setting a stop-loss for the pattern is crucial for managing risk effectively.
Below the most recent swing low. Place the stop-loss just below the most recent swing low within the wedge. This is a conservative approach that provides some room for price fluctuations without exiting too early.
Below the lower trend line of the wedge. Position the stop-loss slightly below the lower trend line of the falling wedge pattern. This method ensures that if the price breaks below the trend line, the pattern is invalidated, and you can exit the trade with minimal losses.
Using a fixed percentage or dollar amount. Depending on your risk tolerance, you can set a stop-loss based on a fixed percentage or dollar amount below your entry point. This method is less tied to the pattern’s technical levels but helps maintain consistent risk management across different trades.
Types of take-profit point
Setting a take-profit target for the pattern involves identifying potential resistance levels where the price is likely to encounter selling pressure.
Measure the height of the wedge. Measure the distance between the widest part of the wedge (from the highest high to the lowest low) and project this distance upward from the breakout point. This projection gives you a price target for taking profits.
Previous support or resistance levels. Identify significant support or resistance levels that were formed before the wedge pattern in the falling wedge pattern. These levels often act as price targets because they represent areas where the price has reacted strongly in the past.
Fibonacci retracement levels. Apply Fibonacci retracement levels to the preceding downtrend. Common targets include the 38.2%, 50%, and 61.8% retracement levels. These levels often coincide with natural areas of resistance where traders might look to take profits.
Characteristics of the falling wedge pattern
- It resembles a narrowing triangle, with both trend lines slanting downward.
- Typically, trading volume decreases as the pattern forms, signaling a decrease in volatility.
- The pattern can form over several weeks or months, depending on the timeframe of the chart.
- While it’s a bearish pattern, a breakout can occur in either direction.
- Traders often wait for a breakout confirmation, which is when the price moves decisively above the upper trend line.
Main idea
The Falling Wedge pattern works by identifying a potential reversal in price movement in the market. The main idea is that price fluctuations begin to narrow between two inclined support and resistance lines, creating a triangular shape. In this context, the lower line serves as the inclined support line, and the upper line serves as the inclined resistance line. When the price reaches the upper line, there is a breakout upwards, indicating a potential reversal upwards.
What place does the falling wedge pattern occupy among the figures of technical analysis?
The pattern holds a significant place among stock market patterns as it is one of the primary patterns in technical analysis, serving as an indicator of divergence or a reversal signal. This pattern represents a descending triangle, indicating a narrowing price range and decreasing volatility, which may precede a sharp upward movement. Thus, it helps traders and investors identify the potential for a trend reversal or the development of a new movement.
Volume
The volume of trades in a falling wedge pattern may indicate certain signals regarding its potential direction. Typically, when the price is forming the pattern, trading volume may decrease as it moves from the upper to the lower point of the pattern. However, during the breakout upwards, which is a characteristic feature, there may be an increase in trading volume. This could serve as an indicator of support and confirmation of the upward breakout signal. If the volume increases during the breakout, it can strengthen traders’ confidence in the upward trend continuation.
Why is the falling wedge pattern called bullish?
The pattern is called bullish because, despite its name indicating a downward movement (falling), it often signals a potential bullish reversal in the market. This pattern typically forms during a downtrend, with narrowing price ranges between two sloping trend lines that are converging in a downward direction. While the falling wedge pattern suggests continued downward pressure, the decreasing volatility within the wedge indicates weakening selling momentum. When the price breaks out above the upper trend line of the wedge, it signals a potential reversal to the upside. This breakout is often accompanied by an increase in trading volume, further supporting the bullish sentiment. Therefore, despite its name, it is associated with bullish expectations.
Why does volatility decrease?
Volatility decreases within the falling wedge pattern due to the narrowing price range between the two sloping support and resistance lines. This narrowed range indicates a weakening trading activity and loss of momentum relative to the previous trend. Decreased volatility can result from price consolidation as the market attempts to determine the next direction. In this context, traders often anticipate a breakout above price levels because decreased volatility may signal the weakening of the leading trend. Thus, reduced volatility within the pattern can serve as a signal of a potential upward reversal.
During what period of time does the pattern form?
It typically forms over a period of several weeks to several months, depending on the timeframe of the chart being analyzed and the volatility of the market.
Is it worth using the falling wedge pattern in the cryptocurrency market?
Yes, it can be applied in the cryptocurrency market as well. It’s a widely recognized technical analysis pattern that can help identify potential reversals or trend continuations. However, as with any trading strategy or pattern, it’s essential to use it alongside other indicators and perform thorough analysis to confirm the signals generated by the pattern. Additionally, considering the high volatility of the cryptocurrency market, risk management is crucial when trading based on patterns like the falling wedge.
Can there be a false breakout?
Yes, there can be a false breakout in the falling wedge pattern. This can happen when the price temporarily moves beyond the boundaries of the pattern and then reverses back within it. False breakouts can result from market manipulations or temporary market conditions causing a temporary surge or decline in price. Therefore, it’s important to confirm breakout signals using other technical indicators and consider your own risk.
Is it worth looking for the falling wedge pattern on short timeframes?
Yes, it’s worth looking for it on short timeframes as well. While this pattern is more commonly associated with longer timeframes, it can also appear on shorter ones. However, traders should exercise caution and confirm the pattern with other technical indicators due to the increased noise and potential false signals on shorter timeframes.
How to not miss a breakout in the falling wedge pattern?
To avoid missing a breakout, traders can use various methods:
- Set price alerts at the upper and lower trend lines. This way, you’ll be notified when the price approaches these levels, allowing you to monitor the breakout closely.
- Combine it with other technical indicators such as the Relative Strength Index (RSI), Moving Averages, or Volume indicators. These indicators can provide additional confirmation of a potential breakout.
- Instead of entering a trade immediately after the breakout, wait for confirmation. Look for a strong candlestick close beyond the pattern’s boundary or a significant increase in volume accompanying the breakout.
- Back test the falling wedge pattern on historical price data to understand its reliability and effectiveness.
- Sometimes, false breakouts occur in the market. It’s essential to be patient and wait for a clear confirmation before entering a trade. Rushing into a trade based on a false breakout can lead to losses.
What is the accuracy of the pattern?
The accuracy can vary depending on market conditions, time frame, and other factors. On average, it is around 75%.
In conclusion
By following these guidelines, traders can effectively leverage the falling wedge pattern to identify potential bullish reversals and capitalize on upward price movements. Always combine pattern analysis with other technical indicators and market analysis to enhance the reliability of your trades.
Pingback: Wedge Pattern Unveiled: Mastering Market Trends for Success - Stock 'n Investments
Pingback: Wedge Pattern Trading: How It Works? - Stock 'n Investments