The rising wedge pattern is one of the most challenging stock market patterns in technical analysis. This pattern typically emerges during an uptrend and is classified as a reversal pattern. Also, this pattern is classified as bearish patterns. It can be found on a price chart when prices form higher and lower points that rise upward, but the distance between these points decreases, forming a wedge shape.
Key properties of the rising wedge pattern
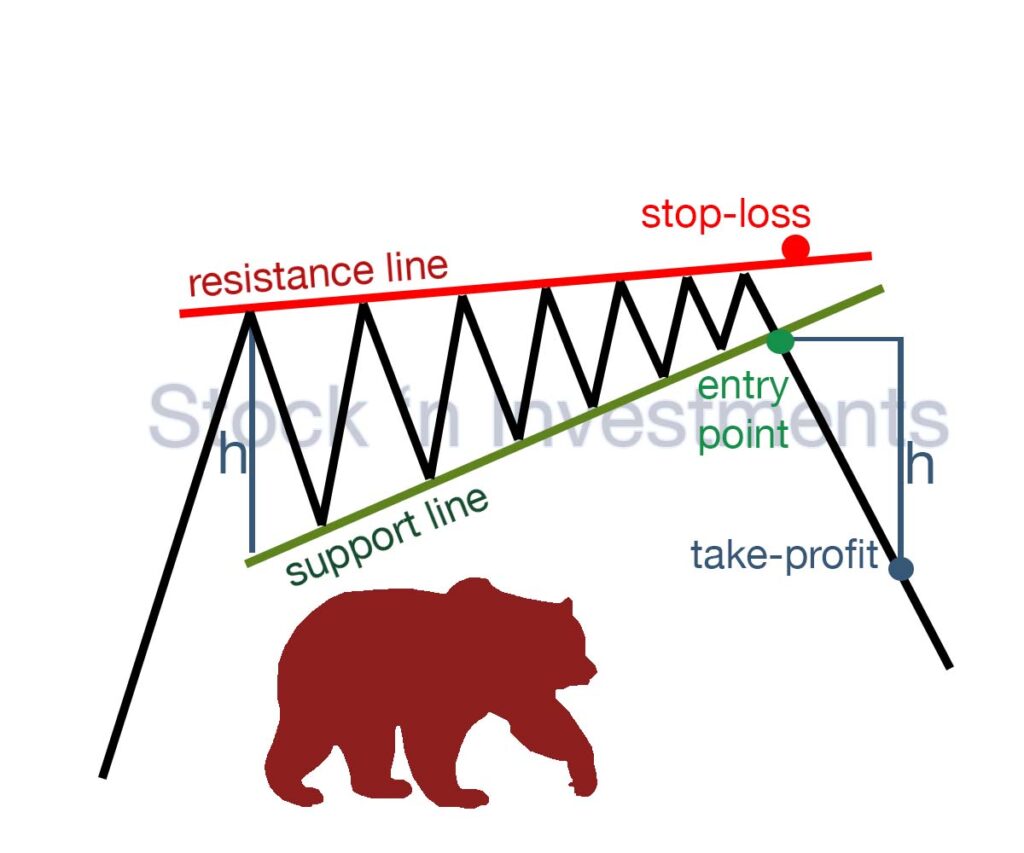
- It appears as a wedge, where the support line (lower line) moves upward, and the resistance line (upper line) also moves upward, but at a slower pace.
- This pattern can indicate a trend reversal, typically from bullish to bearish. It can occur during both bullish and sideways movements.
- During the formation of the rising wedge stock pattern, a decrease in trading volume may be observed, indicating a loss of interest from buyers.
- Upon confirmation of the breakout below the lower support line, the rising wedge may provide a sell signal or a short position.
- The support and resistance lines in the rising wedge can serve as key levels, indicating potential entry and exit points.
- To determine the price target, the height of the wedge from the support line to the resistance line can be measured and then applied to the breakout level.
The main elements of the rising wedge chart pattern
- Resistance Line
- Support Line
- Volume Expansion
Resistance line is a diagonal line that bounds the top of the pattern. It is formed by connecting the high points of prices generated from the uptrend. Support line is also a diagonal line, but it is formed by connecting the declining lows of prices generated from the uptrend. Typically, trading volume decreases as the pattern develops, indicating diminishing market participant interest and a potential trend reversal.
Risk management in the rising wedge pattern
It involves several key strategies to mitigate potential losses and protect investment capital.
- Determine the appropriate size of your position based on your risk tolerance and the potential loss if the trade goes against you. This helps limit the impact of adverse price movements.
- Place stop-loss orders just above the upper trend line if shorting or just below the lower trend line if buying. This helps limit losses if the price breaks out in the opposite direction.
- Set profit targets based on key support or resistance levels, Fibonacci retracement levels, or other technical indicators. Taking profits at predetermined levels can help lock in gains and reduce exposure to adverse price movements.
- Wait for confirmation signals before entering a trade or adjusting your position. Confirmation may come in the form of a candlestick pattern, a breakout with increased volume, or a move in the direction of the prevailing trend.
- Stay informed about market news, economic events, and other factors that could impact the price action of the underlying asset. Adjust your risk management strategy accordingly to adapt to changing market conditions.
- Avoid overconcentration in a single trade or asset class. Diversifying your portfolio can help spread risk and reduce the impact of any single loss.
- Regularly review your risk management strategy and performance to identify areas for improvement. Adjust your approach as needed based on your trading experience and evolving market conditions.
When to expect a breakout?
In different situations, the timing of the breakout may vary, but generally, in an ideal scenario, the breakout in the rising wedge pattern can be expected around the middle or later in the formation of the pattern itself. When the price approaches the upper resistance line, it may experience a breakout downwards, indicating further movement in that direction. Such a breakout may signal a trend reversal and can be used to manage positions or enter new trades.
What happens to trading volume in the rising wedge pattern?
In general, trading volume decreases as it approaches the end of the wedge. This can be an indicator of weakening trend and a potential reversal, as decreasing volume signals a loss of interest in price movement in the current direction.
What does entering a short position during a breakout mean?
Entering a short position during a breakout means selling an asset that you don’t currently own, with the expectation that its price will decrease. This strategy involves borrowing the asset from a broker and selling it on the market, aiming to buy it back at a lower price later to return it to the broker, pocketing the difference as profit.
During what period does the rising wedge pattern form?
Typically, forms over a period of several weeks to several months, depending on the timeframe being analyzed.
Why is the rising wedge stock pattern called bearish?
A rising wedge pattern is often called bearish because it typically signals a potential trend reversal from upward to downward. This pattern commonly occurs during an uptrend and may serve as a warning of a possible change in price direction.
How much can the price fall during a breakout in the rising wedge pattern?
The extent to which the price can fall during a breakout can vary depending on various factors such as market conditions, the strength of the trend, and the volume of trading activity. The price decline following the breakout could be significant, potentially extending to the width of the wedge pattern or even beyond. However, it’s essential to consider other technical indicators and market factors to gauge the potential downside target more accurately.
Could there be a breakout to the upside?
Yes, an upside breakout is possible, but it’s less common compared to the typical downside breakout scenario. An upside breakout may occur due to strong buying pressure or changes in market conditions. However, when this happens, investors typically scrutinize the situation carefully as an upside breakout in a rising wedge pattern can signal a loss of momentum in the prevailing trend or the development of a new movement.
Pingback: Wedge Pattern Unveiled: Mastering Market Trends for Success - Stock 'n Investments
Pingback: Wedge Pattern Trading: How It Works? - Stock 'n Investments