Tag Archives: technical analysis

Technical analysis is a method used to evaluate securities by analyzing statistical trends gathered from trading activity, such as price movement and volume. It relies on historical price data and market activity to forecast future price movements. Technical analysts use various tools and techniques, including chart patterns, technical indicators, and quantitative analysis, to identify potential buy and sell opportunities in the financial markets. The primary assumption of technical analysis is that historical price data can provide insights into future price movements, helping traders make informed decisions about when to enter or exit trades.

Inverse Cup and Handle: Entry & Exit Point, Stop-Loss, Volume

By | July 12, 2024

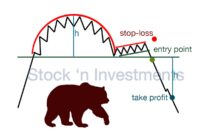
The inverse cup and handle pattern is a bearish reversal pattern, indicating a potential decline in price following a brief consolidation period. It is called an inverted cup and handle or upside-down cup and handle, and it is one of the stock market patterns. Steps for trading the inverse cup and handle pattern Identify the… Read More »
Bull & Bear Flag Pattern Trading

By | June 24, 2024

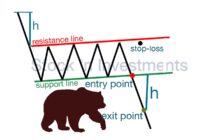
Mastering bull & bear flag pattern trading can significantly enhance your ability to predict market trends and make informed trading decisions. Flag patterns can be powerful tools for trading in trending markets. By understanding their formation and using proper entry, stop-loss, and profit target strategies, traders can effectively capitalize on these patterns. Bull flag pattern… Read More »

Triangle Pattern Trading: Examples and Advice for 4 Patterns

By | June 18, 2024

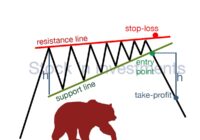
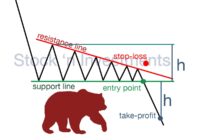
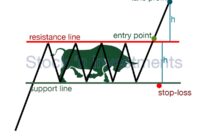
Triangle pattern trading: why 4 formations and not 3? These patterns are popular chart patterns in technical analysis that can indicate the continuation or reversal of a trend. There are three main types of triangle patterns: ascending, descending, and symmetrical. A symmetrical triangle comes in two types: bullish and bearish. All these patterns belong to… Read More »

Head and Shoulders Chart Pattern: Entry and Exit Points

By | July 14, 2024

The head and shoulders chart pattern is a popular stock market patterns that signal a potential reversal in trend. There is the classic and the inverse head and shoulders, which indicates a bullish reversal in a downtrend when the price breaks above the neckline. For successful trading, it is essential to correctly determine entry and… Read More »

Cup and Handle: Breakout, Stop-Loss, Volume & Indicators

By | July 14, 2024

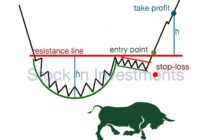
The cup and handle pattern is a classic bullish technical analysis pattern that signals the continuation of an upward trend. It is one of the stock market patterns. To trade successfully in the markets, it is essential to study this pattern. Cup and handle breakout Identification. The pattern starts with a rounded bottom (the cup)… Read More »

Essential Techniques for Trading Analysis

By | May 29, 2024

Trading analysis involves a variety of methods and tools to evaluate and make informed decisions about market movements. To trade successfully in financial markets, you need to be prepared and have the necessary knowledge. Trading without it is possible, but such trading will bring disappointment in 99% of cases. Therefore, I advise you to familiarize… Read More »

Inverted Cup and Handle: Entry and Exit Points

By | July 14, 2024

The inverted cup and handle pattern is a bearish continuation pattern that typically indicates a potential decline in prices after a period of consolidation. This pattern is the inverse of the bullish cup and handle pattern and is used by traders to identify selling opportunities. This is one of the stock market patterns. Key characteristics… Read More »

Descending Wedge Pattern: Entry & Exit Points

By | July 14, 2024

At first glance, trading seems simple. You just need to know two points: the entry point into a position and the exit point from it. The problem is that no one knows exactly where these points are. However, there are certain patterns, called stock market patterns or technical analysis figures, that can help. Let’s find… Read More »

Ascending Wedge Pattern: How to Use It?

By | July 14, 2024

The ascending wedge pattern, also known as a rising wedge pattern, is typically viewed as a bearish chart pattern in stock market patterns or technical analysis. It indicates a potential reversal or continuation of a downtrend. This pattern is formed by two converging trend lines that slope upwards, indicating a weakening uptrend. Types of ascending… Read More »

How to Use the Descending Triangle Pattern?

By | July 14, 2024

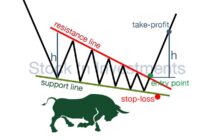
The main idea of the descending triangle pattern is that this technical analysis pattern signals a potential downward price breakout. A descending triangle forms when the price of an asset creates a series of lower highs, forming a descending trend line, while the lows remain roughly at the same level, forming a horizontal support line.… Read More »

Ascending Triangle Pattern: Technical Analysis

By | July 13, 2024

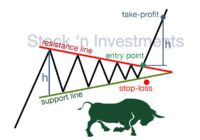
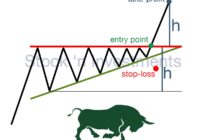
This is one of the stock market patterns. The importance of the ascending triangle pattern lies in its ability to serve as a signal for trend continuation. When the price approaches the upper horizontal line (resistance) and forms higher lows, it may indicate increasing demand and an attempt by the market to overcome resistance. Traders… Read More »

Rising Wedge Pattern: What to Pay Attention to?

By | July 14, 2024

The rising wedge pattern is one of the most challenging stock market patterns in technical analysis. This pattern typically emerges during an uptrend and is classified as a reversal pattern. Also, this pattern is classified as bearish patterns. It can be found on a price chart when prices form higher and lower points that rise… Read More »

Triangle Patterns: Understanding & Analytics

By | July 16, 2024

Embarking on the exploration of triangle patterns suggests you’re an aspiring trader, eager for knowledge. You’re on the right path. Mastering technical analysis patterns is crucial for trading success. By the end of this article, you’ll have a firm grasp on how to effectively utilize triangle patterns. With vivid diagrams and clear descriptions, consider this… Read More »

Stock Market Patterns Trading: All Charts

By | July 21, 2024

If you’re seeking technical analysis of the stock market patterns, you’re likely a novice and eager to learn more. You’re on the right track. Successful trading requires knowledge of technical analysis patterns. This article compiles the main patterns used by professional traders. Each pattern includes a schematic representation and a brief description. Additionally, clicking on… Read More »

Double Top Pattern: Tips, Mistakes & How to Trade

By | June 28, 2024

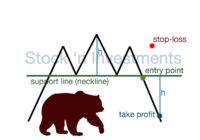
Double top pattern is a one of stock market patterns that signals a potential reversal of an upward trend. The pattern consists of two consecutive peaks at approximately the same level, with a trough in between. How to trade the double top pattern? Trading the pattern involves identifying key points for entering and exiting trades.… Read More »