Tag Archives: Double Bottom Pattern

The Double Bottom Pattern is a reliable indicator of a potential bullish reversal, especially when confirmed by a breakout above the neckline with increased volume. Traders often use this pattern in conjunction with other technical analysis tools and indicators to validate the signal and manage risks effectively. By understanding the formation and key characteristics of the Double Bottom Pattern, traders can make more informed decisions and enhance their trading strategies.

Stock Market Patterns Trading: All Charts

By | July 21, 2024

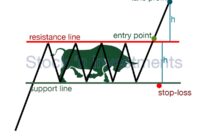
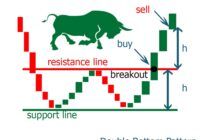
If you’re seeking technical analysis of the stock market patterns, you’re likely a novice and eager to learn more. You’re on the right track. Successful trading requires knowledge of technical analysis patterns. This article compiles the main patterns used by professional traders. Each pattern includes a schematic representation and a brief description. Additionally, clicking on… Read More »

Double Bottom Pattern in Stock Markets

By | May 24, 2024

If you’ve landed on this page and started reading, you’re probably eager to learn about technical analysis patterns. That’s a good start. Successful trading requires knowing different patterns and how to use them. Today, we’ll discuss the double bottom pattern. We’ll schematically depict all the details and explore how to utilize this pattern. What is… Read More »