If you’re seeking technical analysis of the stock market patterns, you’re likely a novice and eager to learn more. You’re on the right track. Successful trading requires knowledge of technical analysis patterns. This article compiles the main patterns used by professional traders. Each pattern includes a schematic representation and a brief description. Additionally, clicking on the section headings will provide insights into how to use them. Best of luck on your trading journey, future trader!
Stock market formations can be broadly categorized into two types: trend continuation and reversal. Trend continuation patterns indicate the continuation of price movement in the direction of the current trend. Reversal patterns signal potential price direction changes and offer insight into market entry points.
Trend patterns as part of the stock market patterns
Trend patterns in technical analysis include the following figures:
- triangle patterns
- rectangle patterns
- flag patterns
Trading triangle patterns as part of stock market patterns
Symmetrical triangle pattern trading
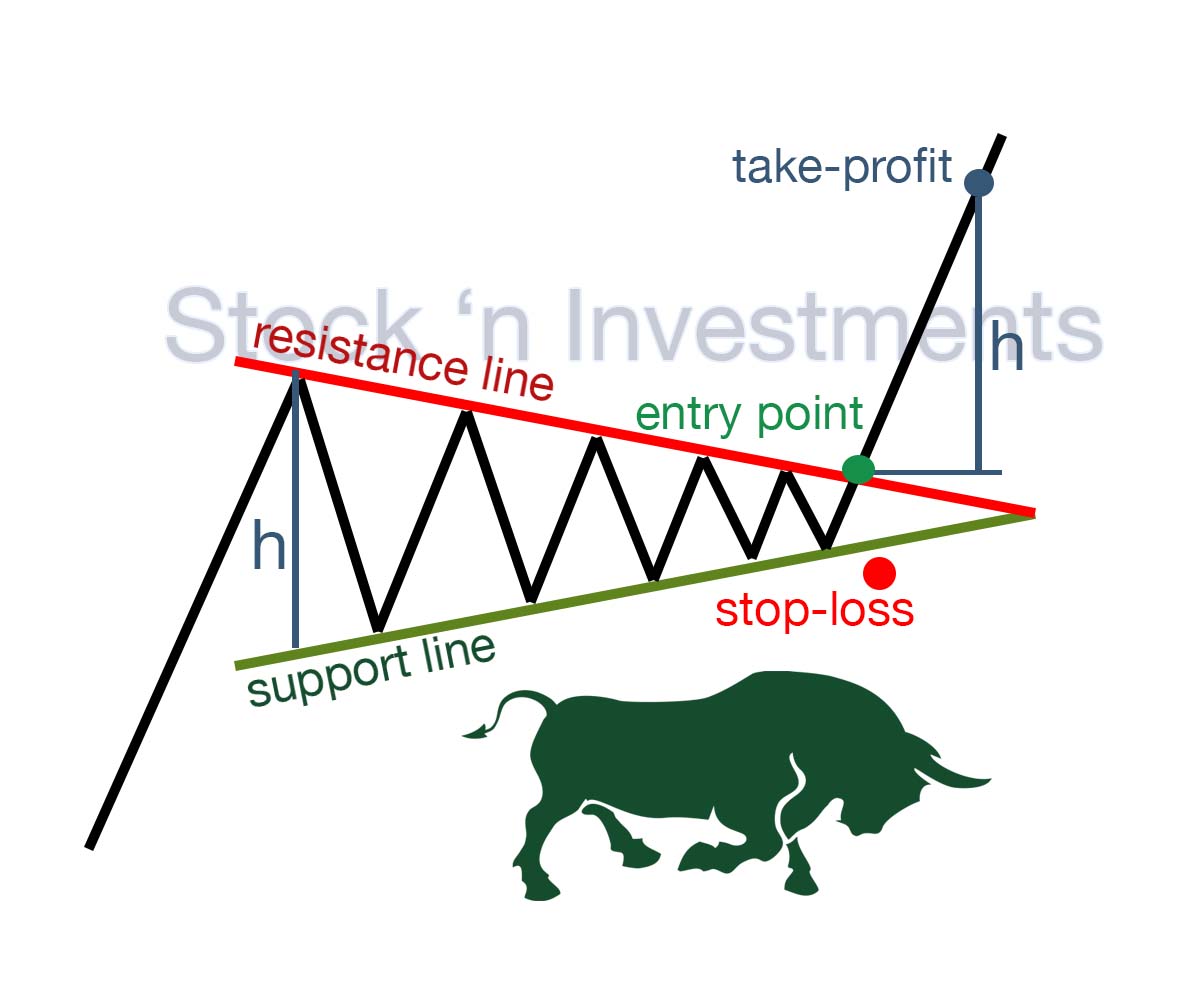
The bullish symmetrical triangle pattern is a continuation pattern that forms when the price consolidates between ascending and descending trend lines. It indicates a balance between buyers and sellers. A breakout above the upper trend line signals the continuation of the upward trend.
The bearish symmetrical triangles are a continuation stock market patterns that form when the price fluctuates between descending and ascending trend lines. It shows a balance between buyers and sellers. When the price breaks below the lower trend line, it signals the continuation of the downward trend.
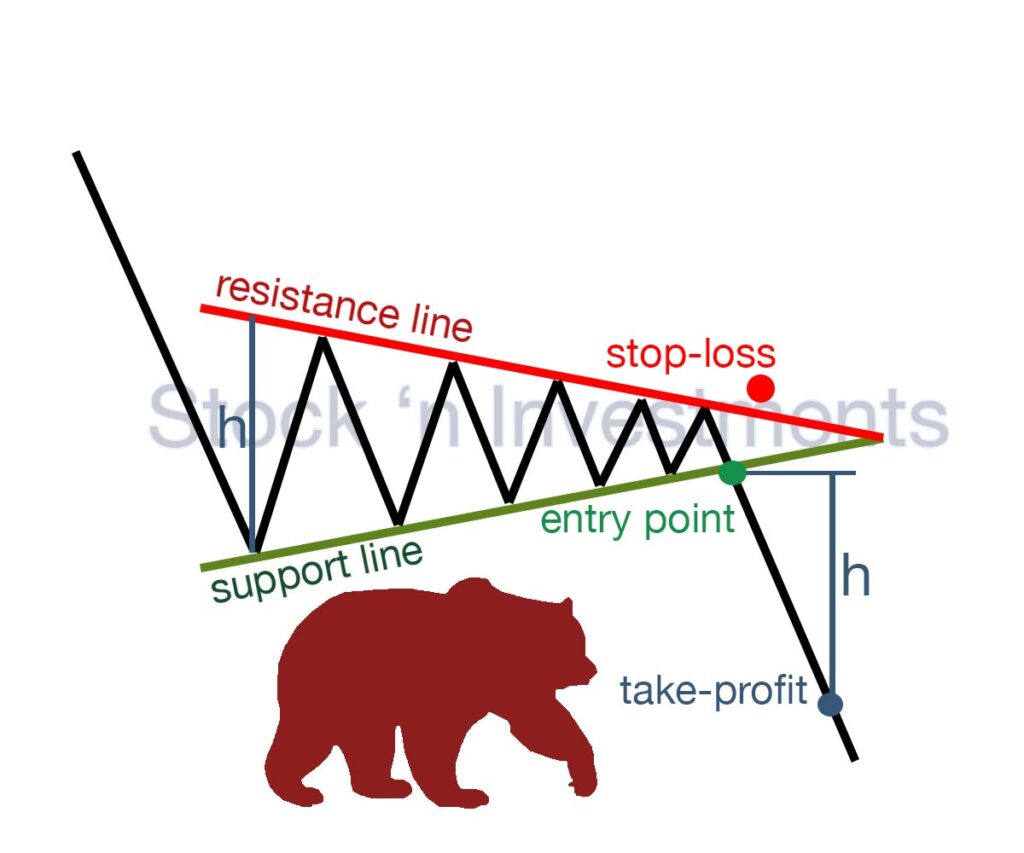
Breakout. Enter the trade after a confirmed breakout above the upper trend line (for a bullish pattern) or below the lower trend line (for a bearish pattern).
Stop-loss. Place the stop-loss just below the lower trend line (for a bullish breakout) or just above the upper trend line (for a bearish breakout).
Take-profit. Measure the height of the triangle and project it from the breakout point, or set take-profit at significant support or resistance levels.
Ascending triangle pattern trading
The triangle ascending pattern as one of the stock market patterns is important because it indicates gradual strengthening of buyers. The price consolidates between a horizontal resistance line and an ascending support line. A breakout above the resistance signals a strong upward trend.
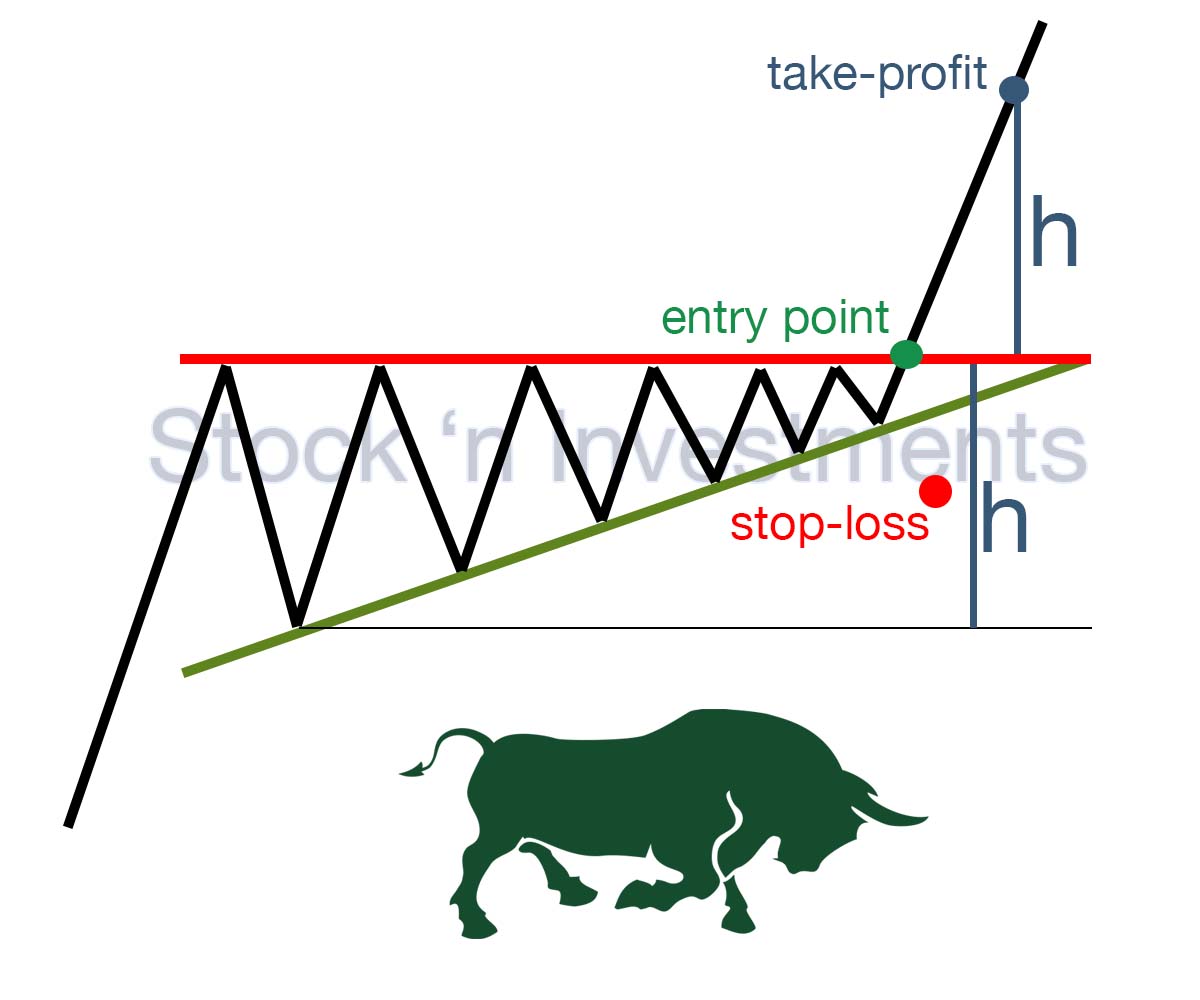
Breakout. Enter the trade after a confirmed breakout above the horizontal resistance level.
Stop-loss. Place the stop-loss just below the ascending trend line or slightly below the breakout level.
Take-profit. Measure the height of the triangle and project it upward from the breakout point, or set take-profit at significant resistance levels.
Descending triangle pattern trading
The triangle descending pattern as one of the stock market patterns differs from the ascending triangle pattern in that the descending triangle has a horizontal support line and a descending resistance line, whereas the ascending triangle has a horizontal resistance line and an ascending support line. One indicates strengthening sellers, while the other indicates strengthening buyers.
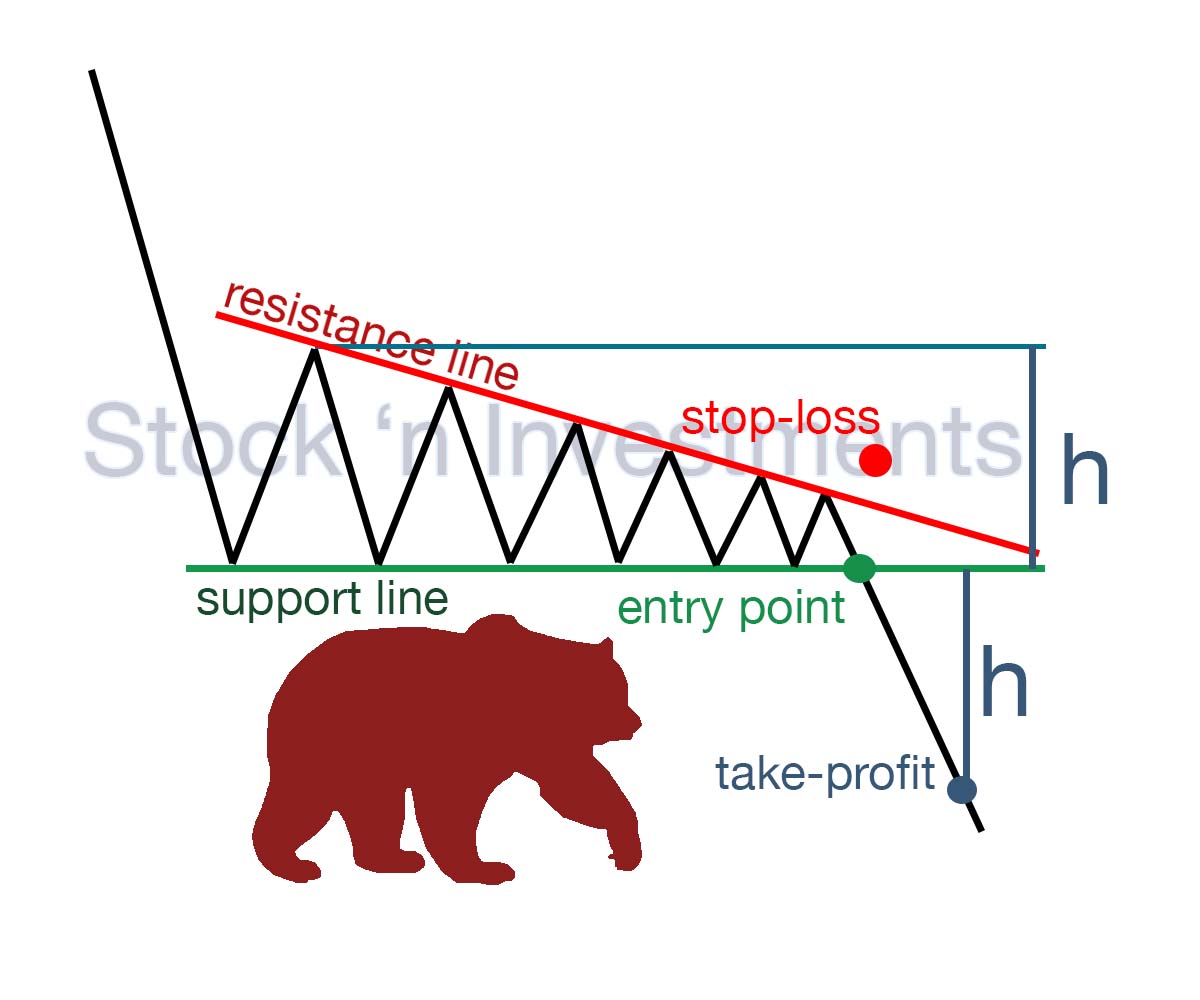
Breakout. Enter the trade after a confirmed breakout below the horizontal support level.
Stop-loss. Place the stop-loss just above the descending trendline or slightly above the breakout level.
Take-profit. Measure the height of the triangle and project it downward from the breakout point, or set take-profit at significant support levels.
Trading the rectangle pattern as part of stock market patterns
The rectangle is a simple yet powerful tool in stock markets, used in trading to identify trends and determine market entry opportunities. This formation can be a key indicator of trend continuation, enabling traders to execute successful trades.
Bullish rectangle pattern trading
One of the main advantages of the rectangle is its ease of identification on charts. It consists of parallel support and resistance lines that bound price fluctuations of an asset over a certain period of time. When the price remains within the rectangle, it indicates market stability and continuation of the current trend.
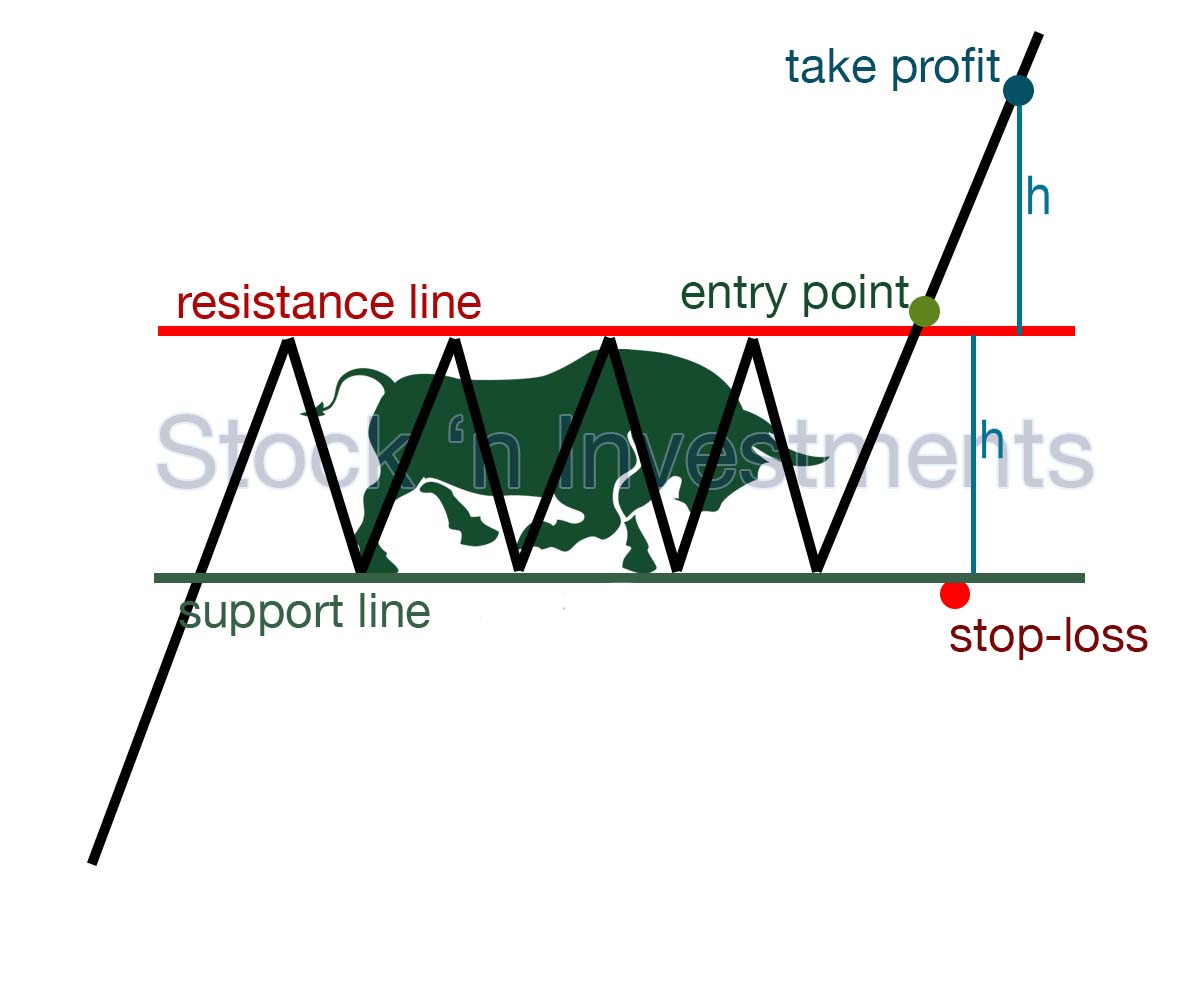
Breakout. Enter the trade after a confirmed breakout above the horizontal resistance level of a bullish rectangle, one of the stock market chart patterns.
Stop-loss. Place the stop-loss just below the horizontal support level.
Take-profit. Measure the height of the rectangle and project it upward from the breakout point, or set take-profit at significant resistance levels.
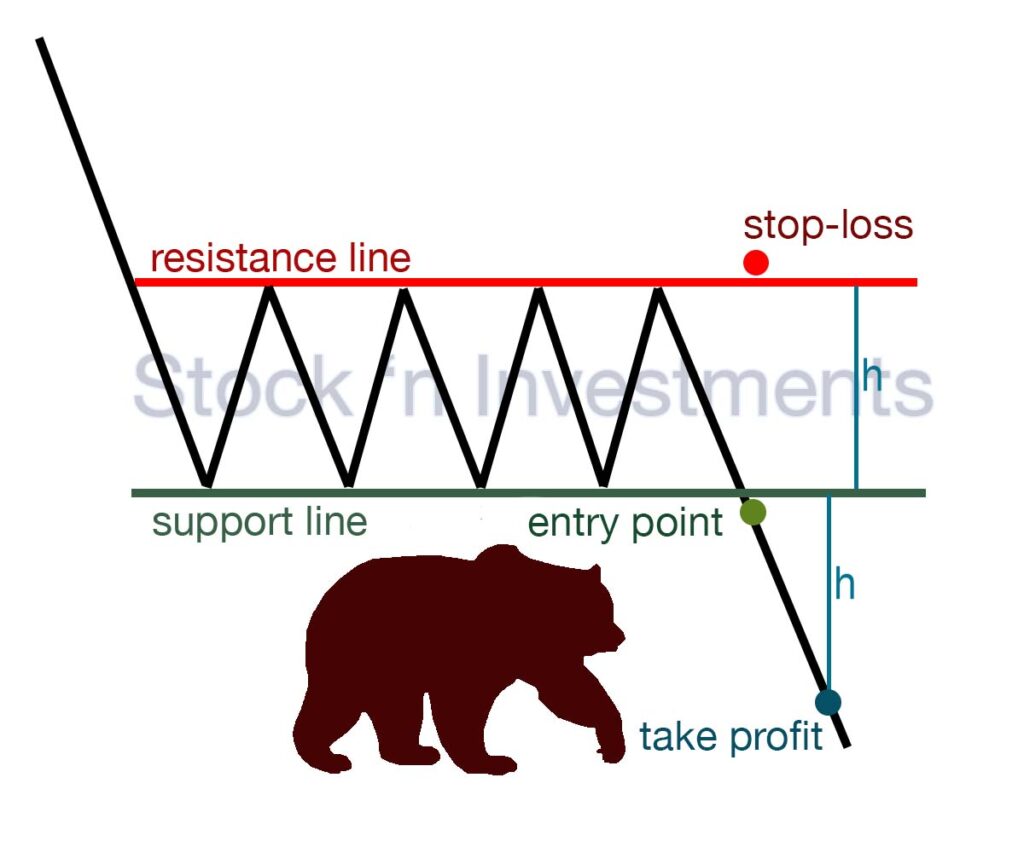
Bearish rectangle pattern trading
Traders use rectangles to identify market entry opportunities. For instance, when the price crosses above the upper boundary of the rectangle and continues to move upward, it may signal an opportunity to open a long position. Conversely, a breakthrough below the lower boundary may indicate the potential start of a new downtrend, signaling an opportunity to open a short position.
Given the simplicity and effectiveness of the rectangle in stock market pattern analysis, it remains a popular tool among traders worldwide.
Breakout. Enter the trade after a confirmed breakout below the horizontal support level.
Stop-loss. Place the stop-loss just above the horizontal resistance level.
Take-profit. Measure the height of the rectangle and project it downward from the breakout point, or set take-profit at significant support levels.
Trading the flag pattern as part of stock market patterns
Bull flag pattern trading
The Bull flag pattern is a technical analysis pattern that indicates a temporary price decrease within a consolidated market environment before the continuation of an upward trend. It is characterized by parallel price movement where a short period of correction (the flag) forms relative to a recent upward movement, followed by an expected resumption of price increase.
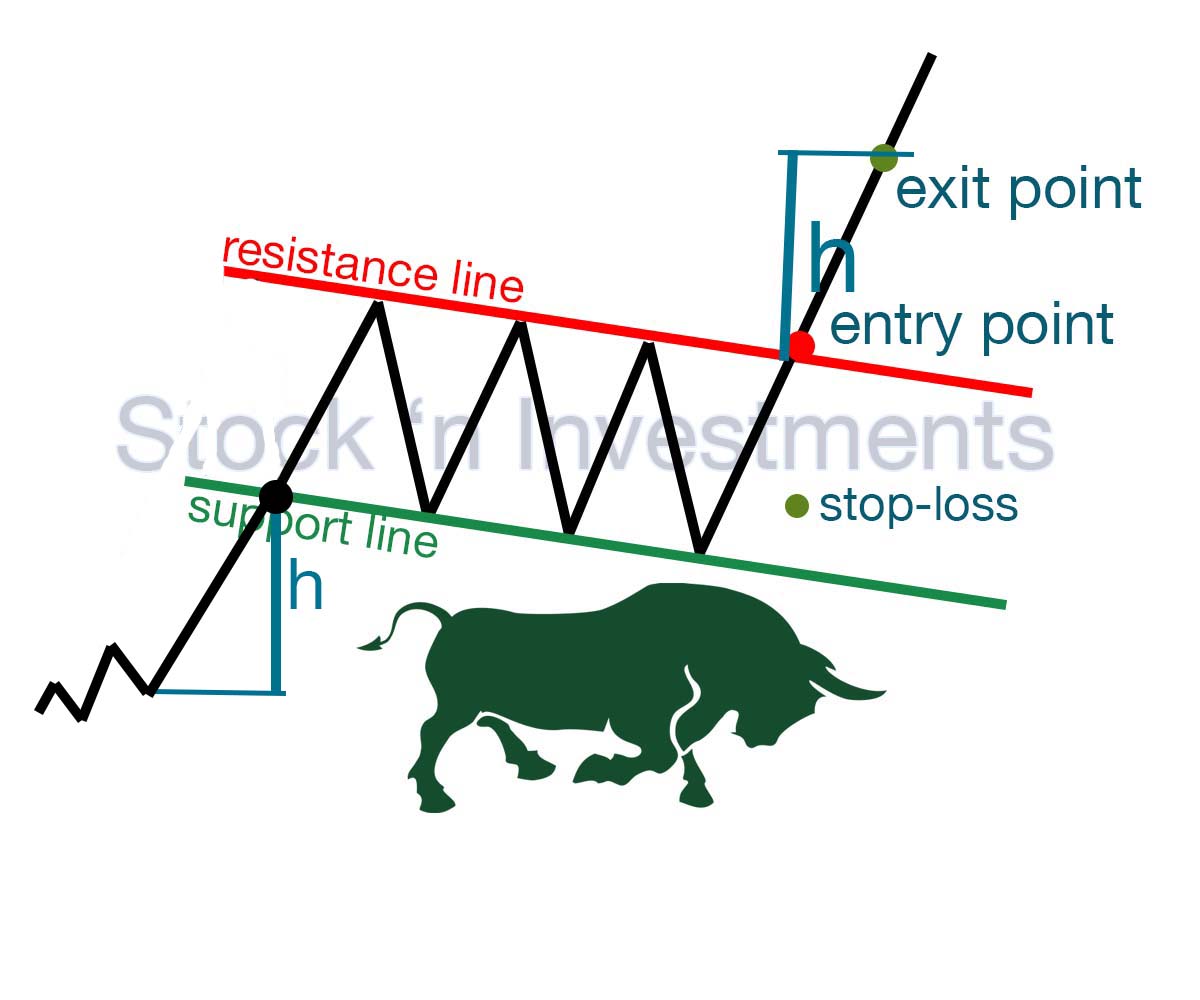
Breakout. Enter the trade after a confirmed breakout above the upper trendline of the flag.
Stop-loss. Place the stop-loss just below the lower trendline of the flag or slightly below the consolidation area.
Take-profit. Measure the height of the flagpole and project it upward from the breakout point, or set take-profit at significant resistance levels.
Bear flag pattern trading
The Bull flag pattern, as one of the stock market patterns, differs from the Bear flag pattern in its direction and expected price movements. In other words, the Bull flag indicates a continuation of the upward trend, while the Bear flag indicates a continuation of the downward trend.
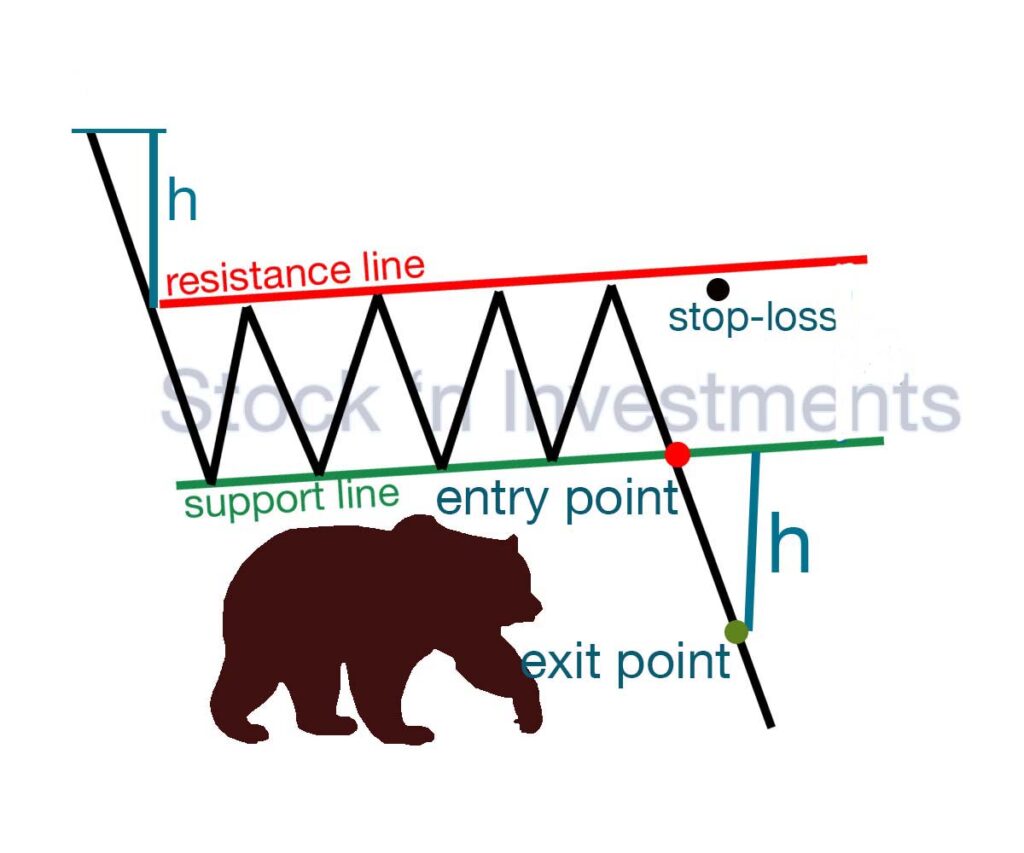
Breakout. Enter the trade after a confirmed breakout below the lower trendline of the flag.
Stop-loss. Place the stop-loss just above the upper trendline of the flag or slightly above the consolidation area.
Take-profit. Measure the height of the flagpole and project it downward from the breakout point, or set take-profit at significant support levels.
Stock market reversal patterns
Reversal patterns in technical analysis include:
- cup and handle patterns
- wedge patterns
- double top & double bottom patterns
- head and shoulders patterns
Trading the cup and handle pattern as part of stock market patterns
Cup and handle pattern trading (classic)
The cup and handle pattern differs from other patterns due to its shape, resembling a cup with a handle. It consists of a rounded “cup” (typically formed after a prolonged price decline) and a small “handle” (a slight price rise) that extends from the top of the cup. This pattern often indicates a potential reversal in price movement.
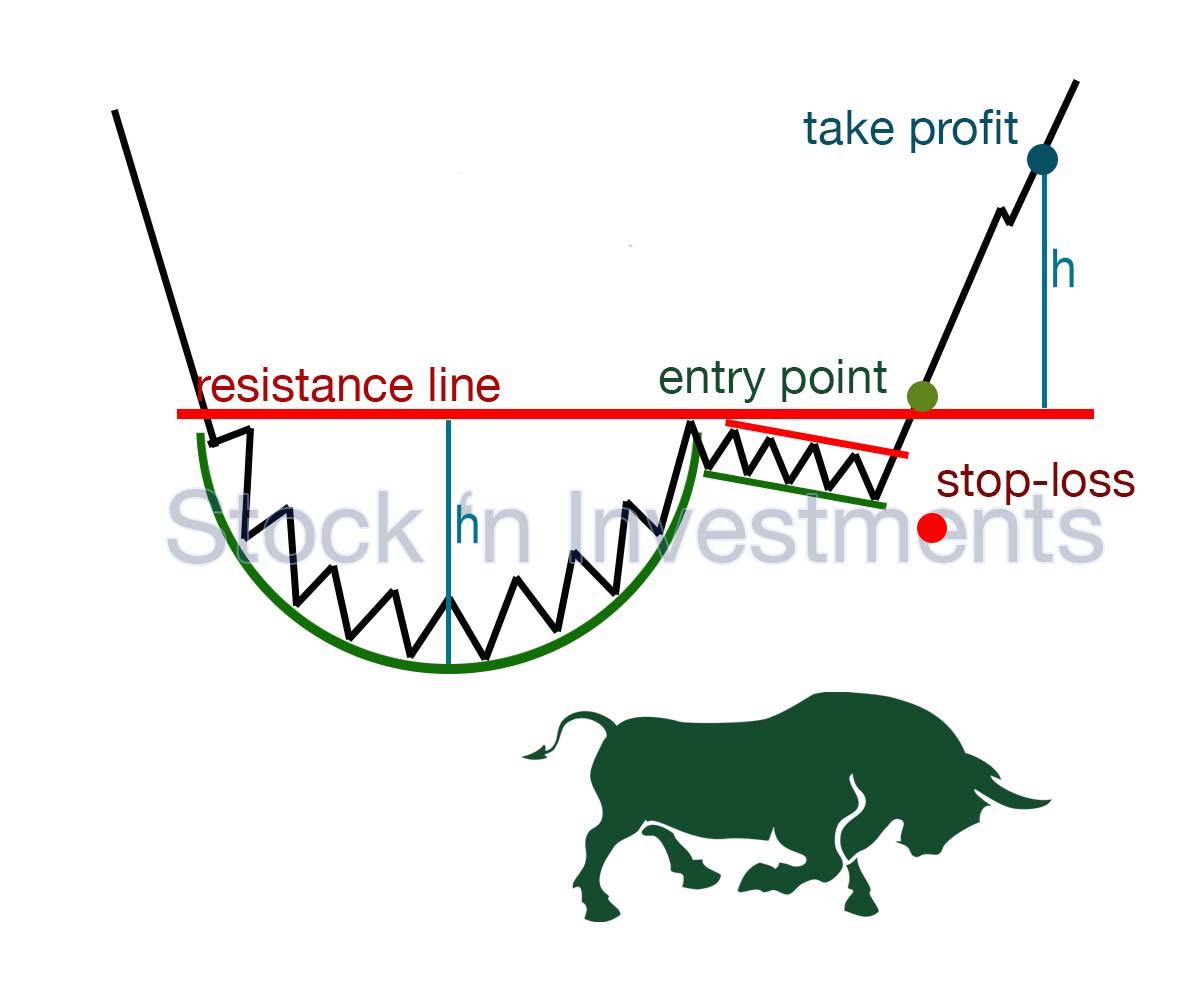
Breakout. Enter the trade after a confirmed breakout above the upper resistance level of the handle.
Stop-loss. Place the stop-loss just below the lower trendline of the handle or slightly below the consolidation area.
Take-profit. Measure the depth of the cup and project it upward from the breakout point, or set take-profit at significant resistance levels.
Inverted cup and handle pattern trading
The difference between the cup and handle pattern and the inverted cup and handle pattern lies in their shape and direction. The cup and handle pattern appears as a “cup with a handle,” typically signaling a potential price reversal after a prolonged decline. In contrast, the inverted cup and handle pattern, as one of the stock market graph patterns, is the inverse version, indicating an initial price rise followed by the formation of a “handle” at the top, suggesting a potential future decline in prices.
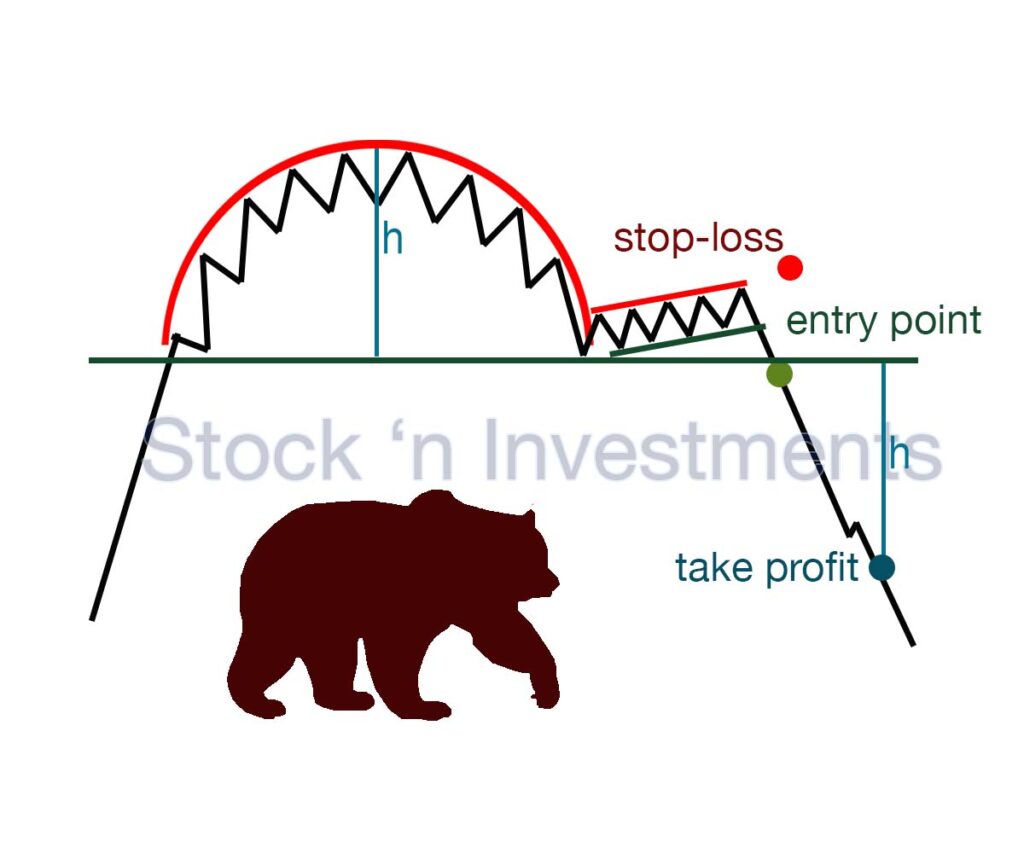
Breakout. Enter the trade after a confirmed breakout below the lower support level of the handle.
Stop-loss. Place the stop-loss just above the upper trendline of the handle or slightly above the consolidation area.
Take-profit. Measure the height of the inverted cup and project it downward from the breakout point, or set take-profit at significant support levels.
Trading the wedge patterns as part of the stock market patterns
Descending wedge pattern trading
The descending wedge pattern is a technical pattern that indicates a potential reversal to an upward trend. It forms when the price fluctuates between two descending support and resistance lines. A decrease in trading volume during the formation of the pattern suggests weakening seller pressure. A breakout above the upper resistance line signals the start of a new upward trend.
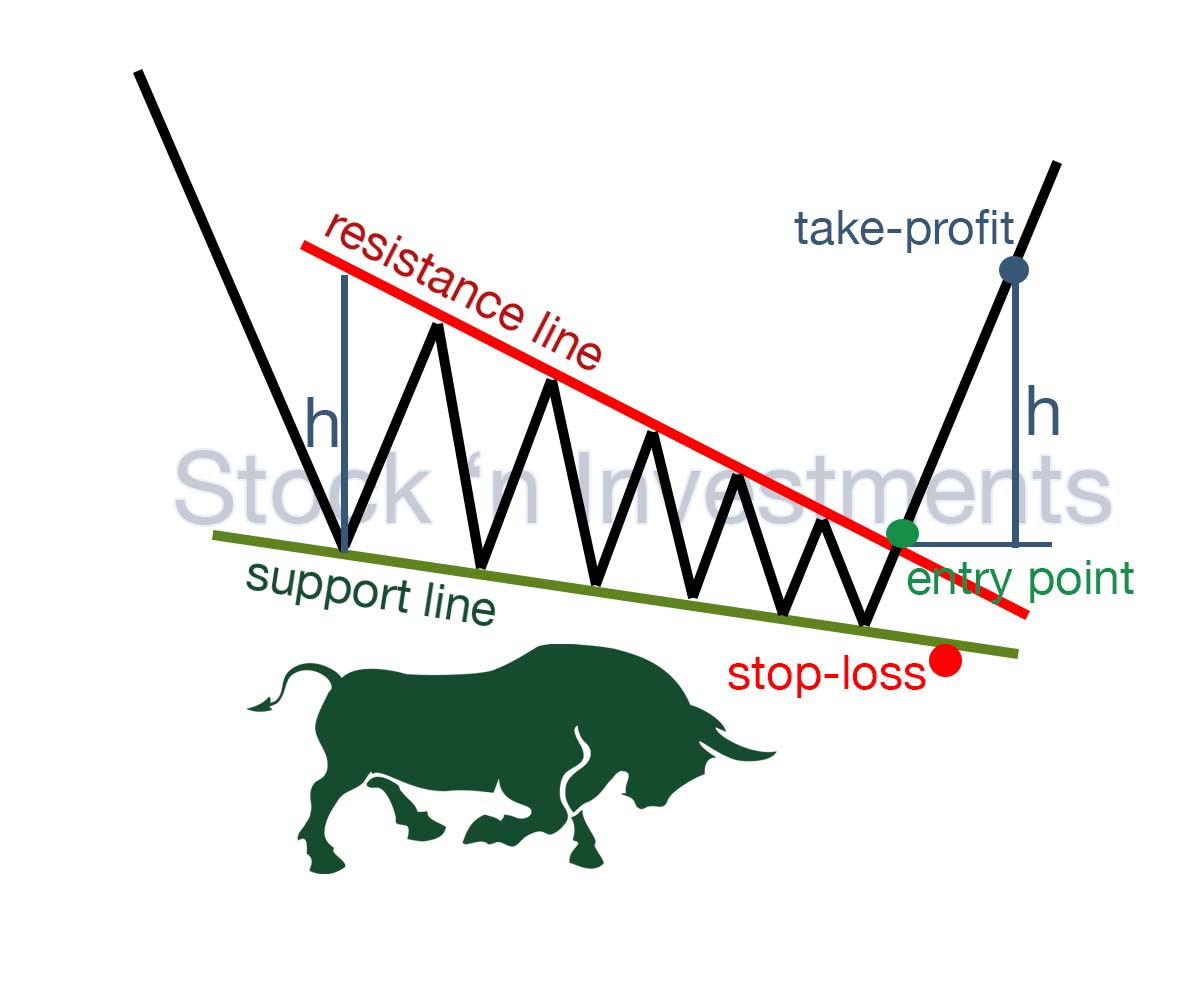
Breakout. Enter the trade after a confirmed breakout above the upper trendline of the wedge.
Stop-loss. Place the stop-loss just below the lower trendline of the wedge or slightly below the lowest point of the pattern.
Take-profit. Measure the height of the wedge and project it upward from the breakout point, or set take-profit at significant resistance levels.
Ascending wedge pattern trading
The ascending wedge pattern, as one of the stock market patterns, differs from the descending wedge pattern in its shape and direction. The ascending wedge signals a potential price decrease, while the descending wedge signals a potential price increase.
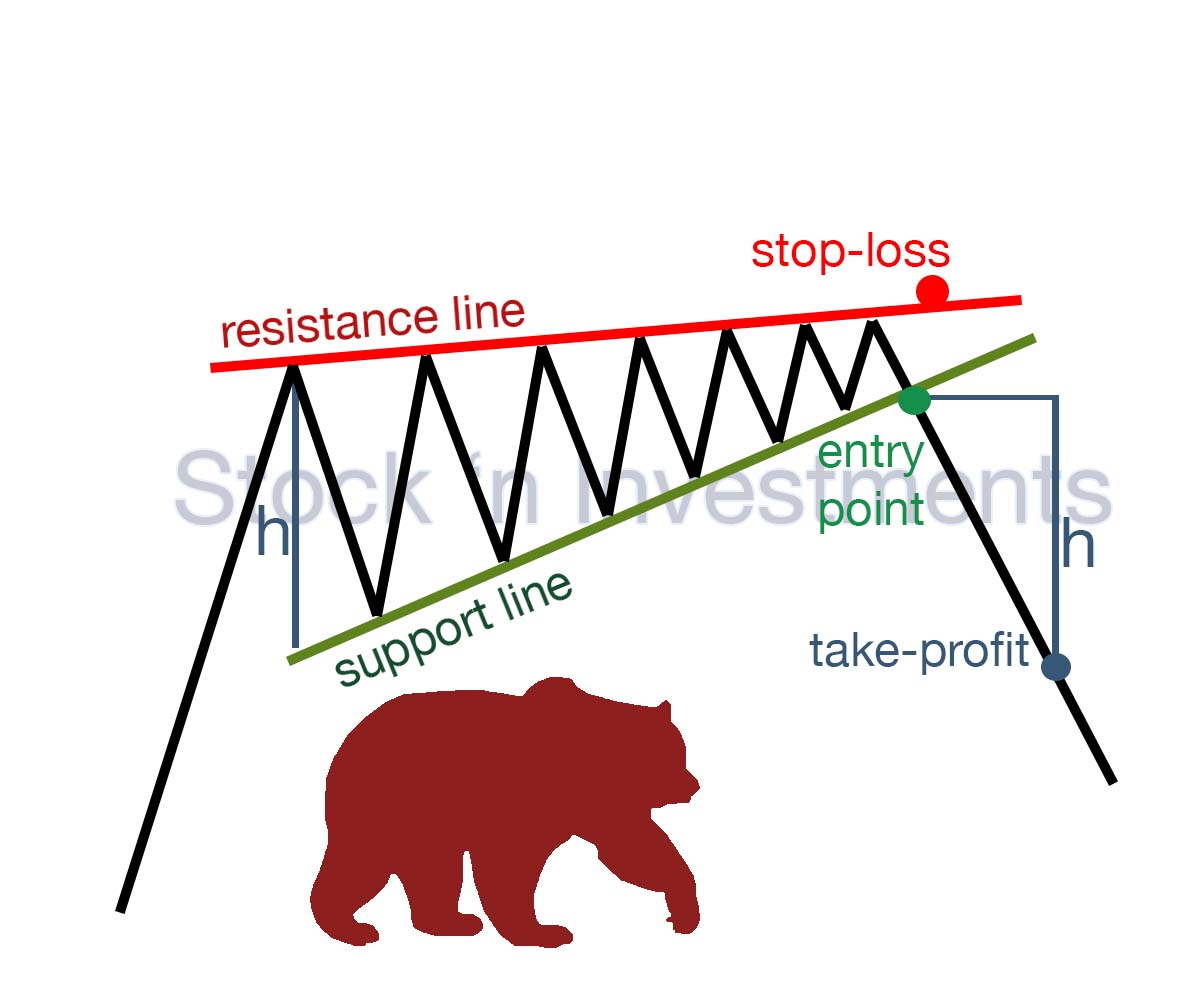
Breakout. Enter the trade after a confirmed breakout below the lower trendline of the wedge.
Stop-loss. Place the stop-loss just above the upper trendline of the wedge or slightly above the highest point of the pattern.
Take-profit. Measure the height of the wedge and project it downward from the breakout point, or set take-profit at significant support levels.
Trading double top & double bottom patterns as part of the stock market patterns
Double top pattern trading
The double top in stock market chart patterns is one of the key patterns indicating a possible end to an uptrend and the beginning of bearish activity in the market. This formation is characterized by two price peaks, roughly at the same level, and a support line that defines a local resistance level.
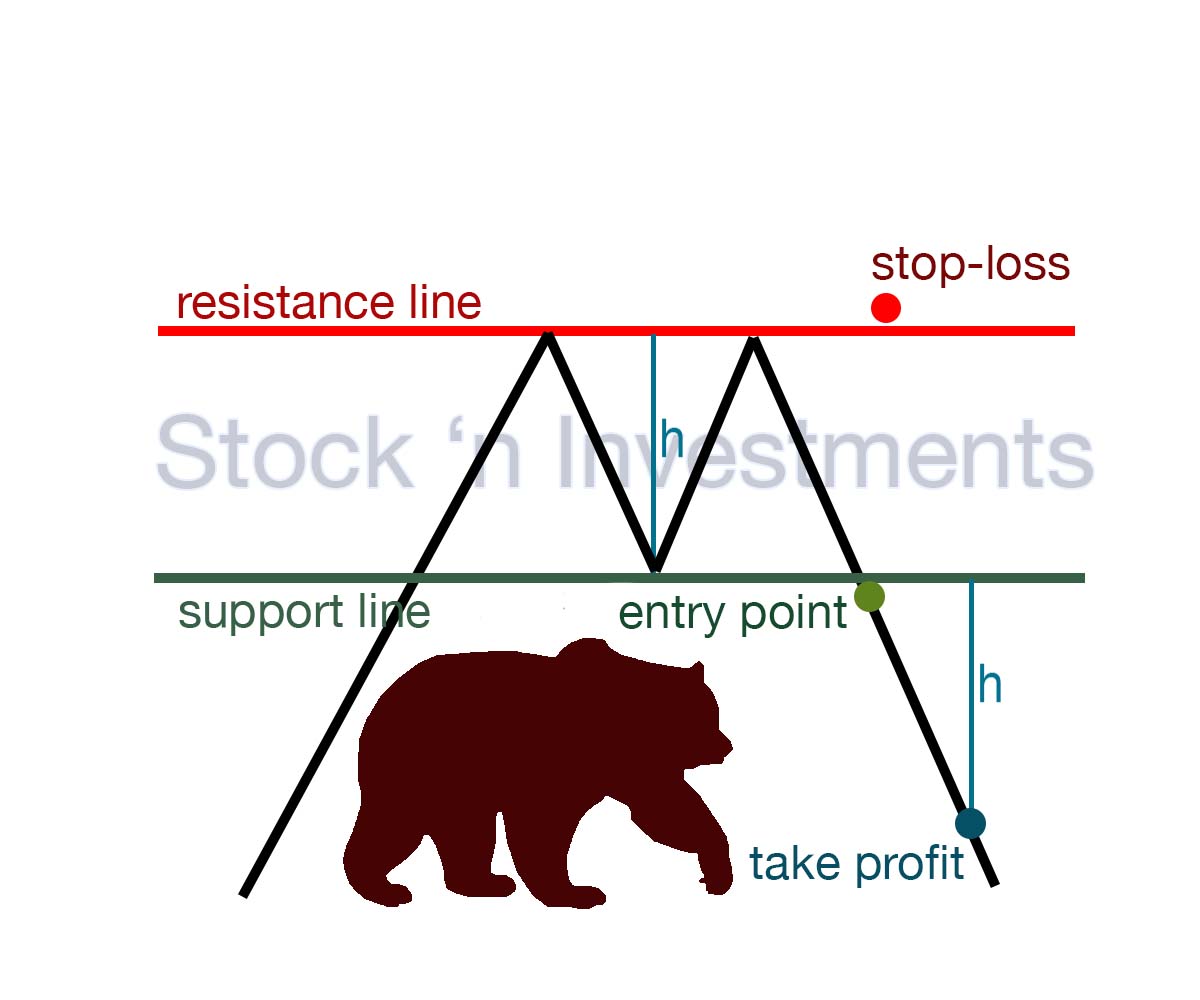
This breakout often serves as a signal to open a short position in the market, as it typically indicates a trend reversal to the downside.
Breakout. Enter the trade after a confirmed breakout below the support level formed by the trough.
Stop-Loss. Place the stop-loss just above the highest point of the two peaks.
Take-Profit. Measure the vertical distance from the peak to the trough and project this downward from the breakout point, or set take-profit at significant support levels.
Double bottom pattern trading
In technical analysis, the double bottom, as one of the stock market patterns, is an important pattern that indicates a potential end to a downtrend and the beginning of bullish activity in the market. This formation is similar to the double top but appears in the opposite direction.
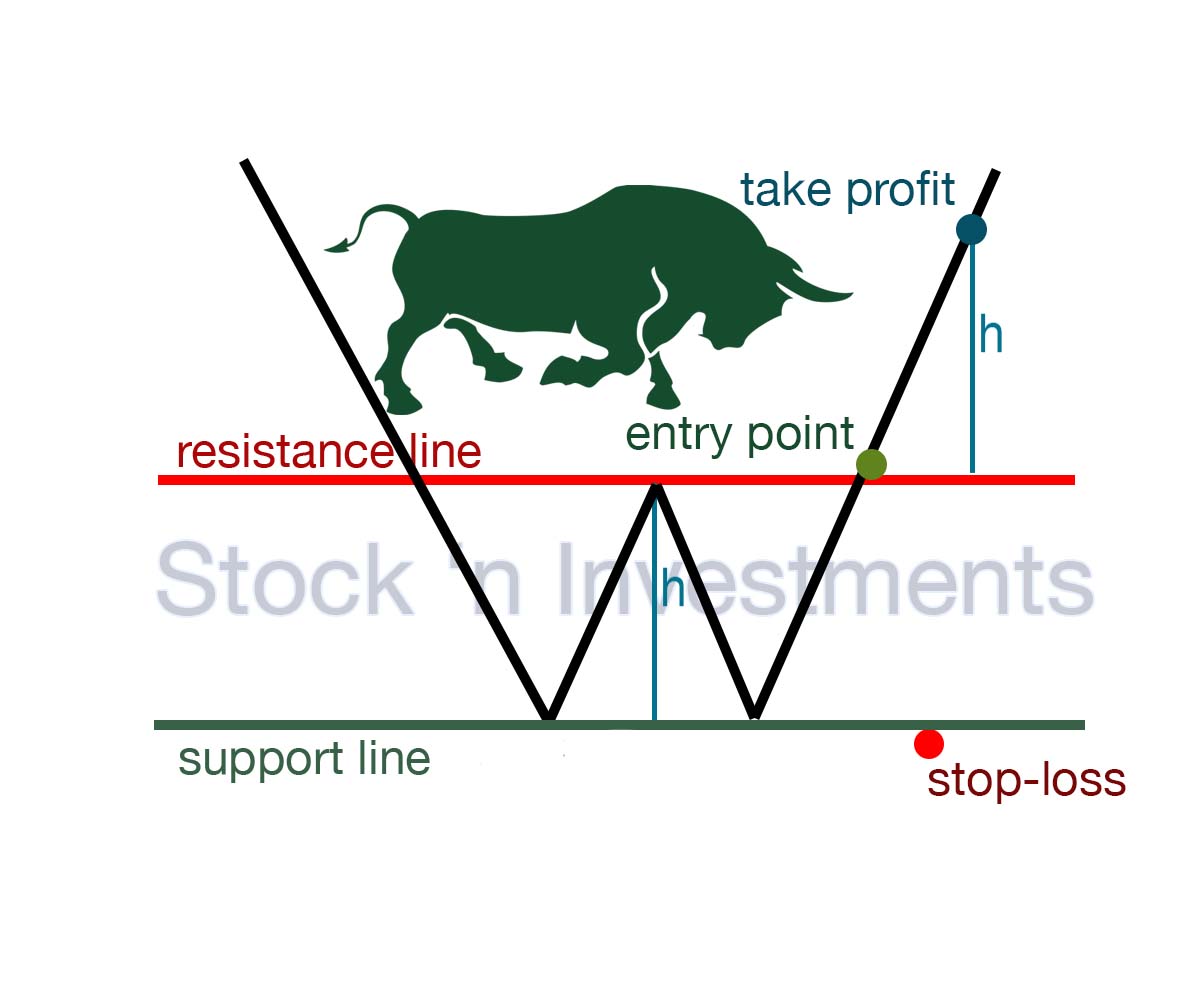
This breakout often serves as a signal for traders to open a long position in the market, as it typically indicates a change in trend to the upside.
Breakout. Enter the trade after a confirmed breakout above the resistance level formed by the peak.
Stop-loss. Place the stop-loss just below the lowest point of the two troughs.
Take-profit. Measure the vertical distance from the trough to the peak and project this upward from the breakout point, or set take-profit at significant resistance levels.
Trading the head and shoulders patterns as part of the stock market patterns
Head and shoulders pattern trading (classic)
The head and shoulders pattern is one of the important elements of stock market graph patterns that helps traders identify potential reversal points in the market. This formation consists of three peaks: the central peak, which is the highest and represents the head, and two side peaks, which are lower and represent the shoulders. All these peaks are supported by a support line, often called the neckline.
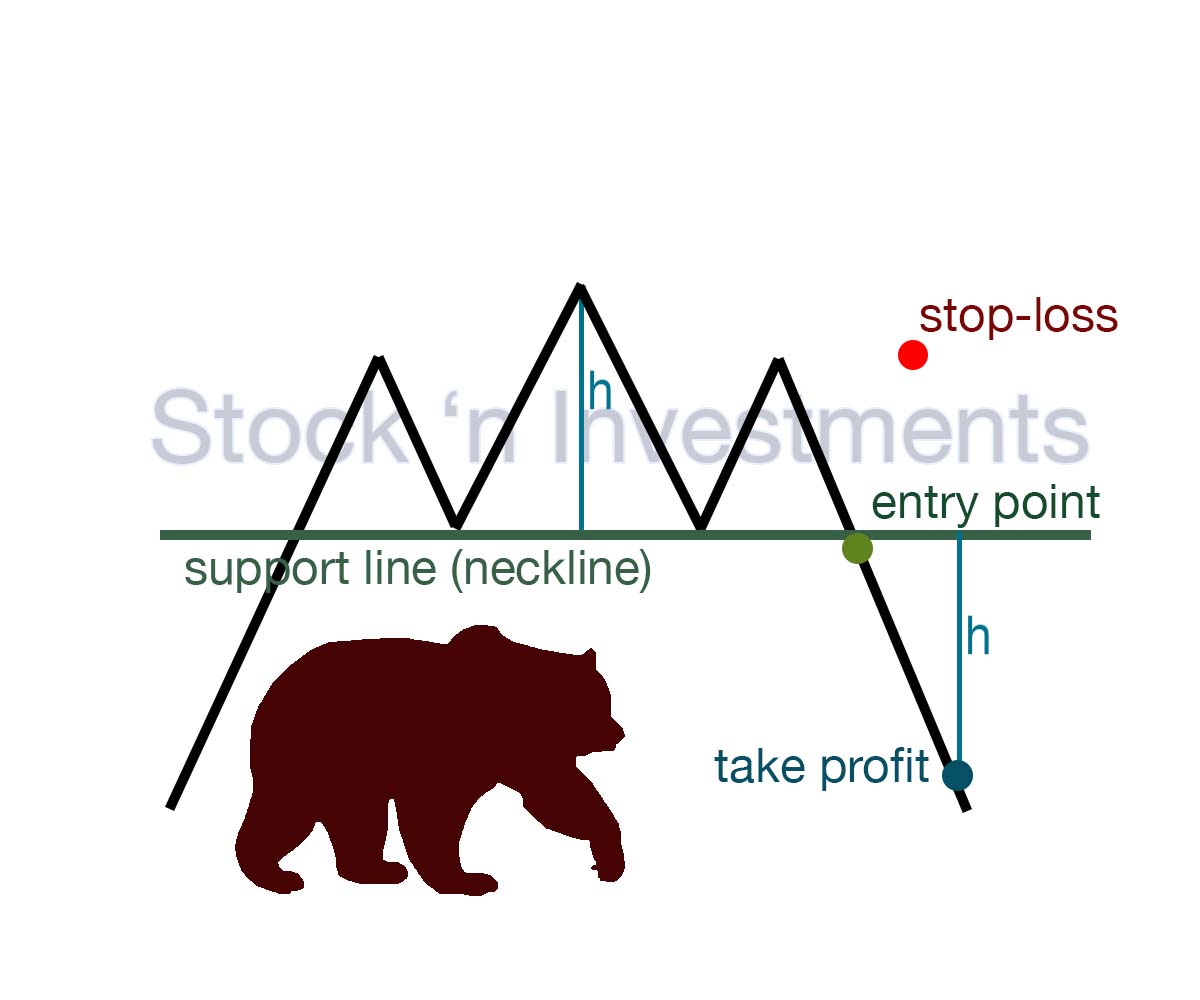
The main idea of the pattern is that after the formation of the head and shoulders, the price may move downwards, breaking the neckline, indicating a possible reversal of the trend from bullish to bearish. Such a breakout of the neckline is often seen as a signal to open a short position by traders.
Breakout. Enter the trade after a confirmed breakout below the neckline.
Stop-loss. Place the stop-loss just above the highest point of the head.
Take-profit. Measure the vertical distance from the neckline to the head and project this downward from the breakout point, or set take-profit at significant support levels.
Inverted head and shoulders pattern trading
The inverted head and shoulders pattern, as one of the stock market patterns, is vital in technical analysis. It signals a possible shift from a downtrend to an uptrend. It appears as a structure with three peaks on a chart. Two lower peaks form the shoulders, while a middle peak forms the inverted head. An essential element of this formation is the resistance line, which is located at the level of the head.
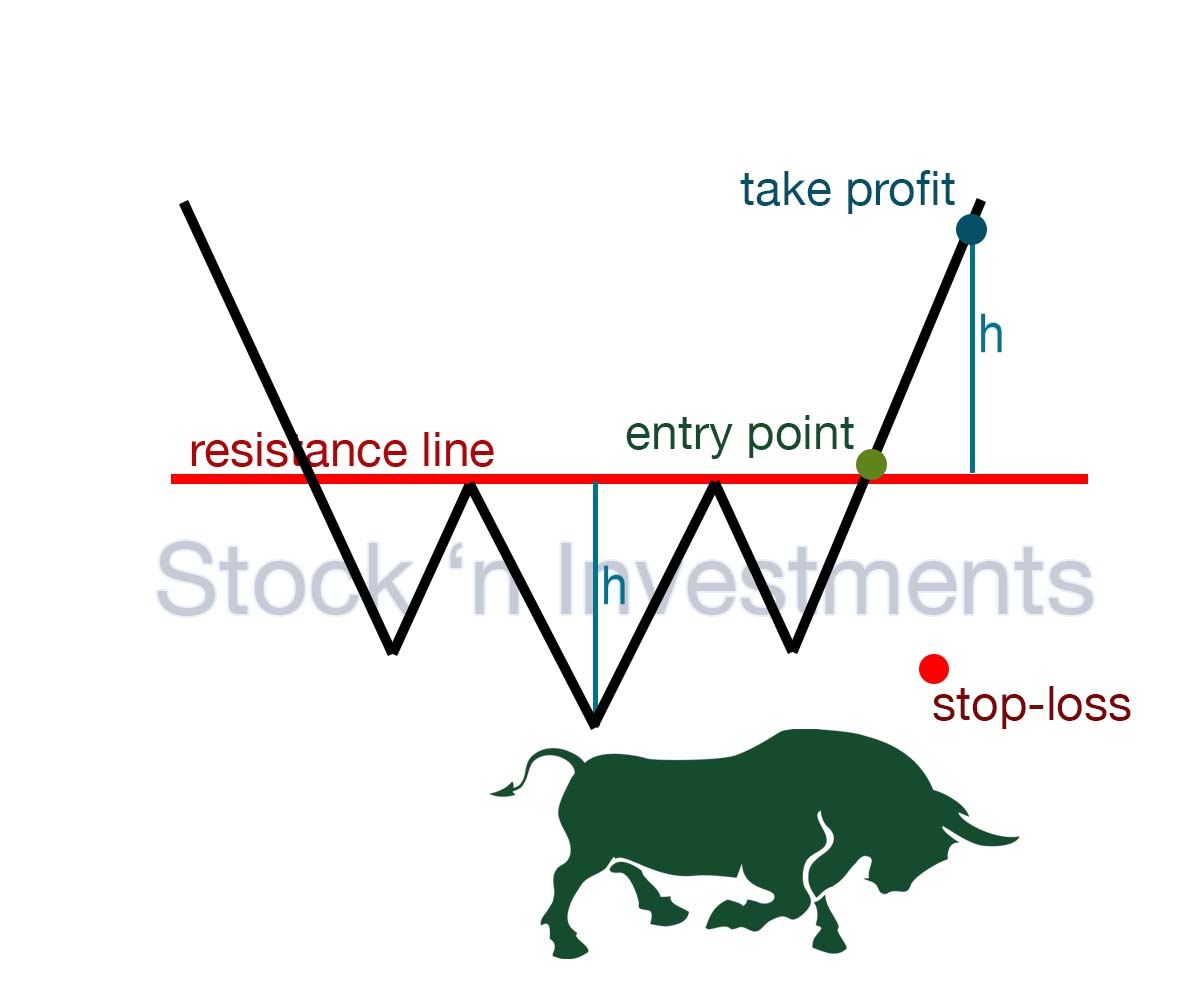
Such a breakout of the neckline is often seen as a signal to open a long position by traders.
Breakout. Enter the trade after a confirmed breakout above the neckline.
Stop-loss. Place the stop-loss just below the lowest point of the head.
Take-profit. Measure the vertical distance from the neckline to the head and project this upward from the breakout point, or set take-profit at significant resistance levels.
In conclusion
Stock market patterns are an essential tool for traders in understanding market movements. They aid in identifying key patterns on price charts, enabling anticipation of future price movements and informed trading decisions. Analyzing these patterns, whether they indicate a reversal or continuation, empowers traders. It helps improve strategy efficacy and minimize risks in financial markets.
Pingback: Технічний аналіз ринку - Світ фінансової грамотності
Pingback: Triangle Patterns in Stock Market Patterns - MW FINANCE
Pingback: Head and Shoulders Pattern: A Trader's Guide to Spotting Trends - Bulls & Bears
Pingback: Head and Shoulders Pattern: A Trader's Guide to Spotting Trends - Stock 'n Investments