If you’re seeking the cup and handle pattern, one of stock market patterns, you’re probably a novice and eager to learn more. You’re on the right track. Knowledge of technical analysis patterns is essential for successful trading. By the end of this article, you’ll understand how to correctly utilize the cup and handle formation. The pattern includes a schematic representation and a brief description. Good luck, future trader!
What is a cup and handle pattern?
The cup and handle pattern is a powerful chart formation. It used by traders to capture strong explosive movements in the market. In this guide, we will explore all the features of trading this formation to help you profit from significant price movements.
The main idea of the cup with handle pattern is that it indicates a change in the asset’s trend from negative to positive or vice versa.
Cup and handle pattern rules
While the interpretation of chart patterns can vary slightly among traders, there are some common rules and guidelines for recognizing and trading the cup and handle pattern
Cup formation of cup and handle chart formation
- Uptrend Reversal. The pattern typically begins with a prolonged downtrend in the price of an asset.
- Round Bottom. As the downtrend starts to reverse, the price forms a rounded bottom, resembling the shape of a cup.
- Duration. The cup formation can take several weeks to several months to develop, depending on the timeframe of the chart being analyzed.
- Depth. The depth of the cup should typically retrace around 30% to 50% of the previous downtrend but can vary.
Handle formation
- Consolidation. Following the cup formation, there is a temporary consolidation or retracement in the price, creating a smaller downward-sloping channel or a sideways movement.
- Duration. The handle formation usually lasts for a shorter duration compared to the cup formation, often many weeks.
Volume
- Decreasing volume. During the formation of the cup and handle, trading volume tends to diminish as the pattern progresses.
- Volume surge. A breakout from the handle should ideally be accompanied by an increase in trading volume, indicating strong buying interest.
Cup and handle breakout
- Resistance break. The confirmation of the pattern occurs when the price breaks out above the resistance level formed by the peak of the cup.
- Volume confirmation. The breakout should ideally be supported by higher-than-average trading volume, signaling conviction among traders.
Tips for successful entry
- Patience. Wait for a confirmed breakout above the resistance level with strong volume.
- Volume. Ensure the breakout is accompanied by significant volume to avoid false breakouts.
- Multiple timeframes. Confirm the pattern on multiple timeframes to ensure the reliability of the breakout signal.
Cup and handle target price
- Projection. Traders typically project a target price for the upside movement by measuring the depth of the cup and adding it to the breakout point.
Validation
- Confirmation. It’s essential to wait for confirmation of the breakout before entering a trade, as false breakouts can occur.
- Supportive Indicators. Confirmatory signals from other technical indicators, such as moving averages or oscillators, can strengthen the validity of the pattern.
These rules serve as guidelines for identifying and trading the cup and handle pattern. However, traders should exercise caution and use additional analysis and risk management techniques to validate signals and manage potential losses.
Inverted cup and handle pattern
The inverted or upside down cup and handle pattern is a bearish reversal pattern that typically forms at the end of an uptrend. It is the opposite of cup and handle formation, which is bullish and forms at the end of a downtrend.
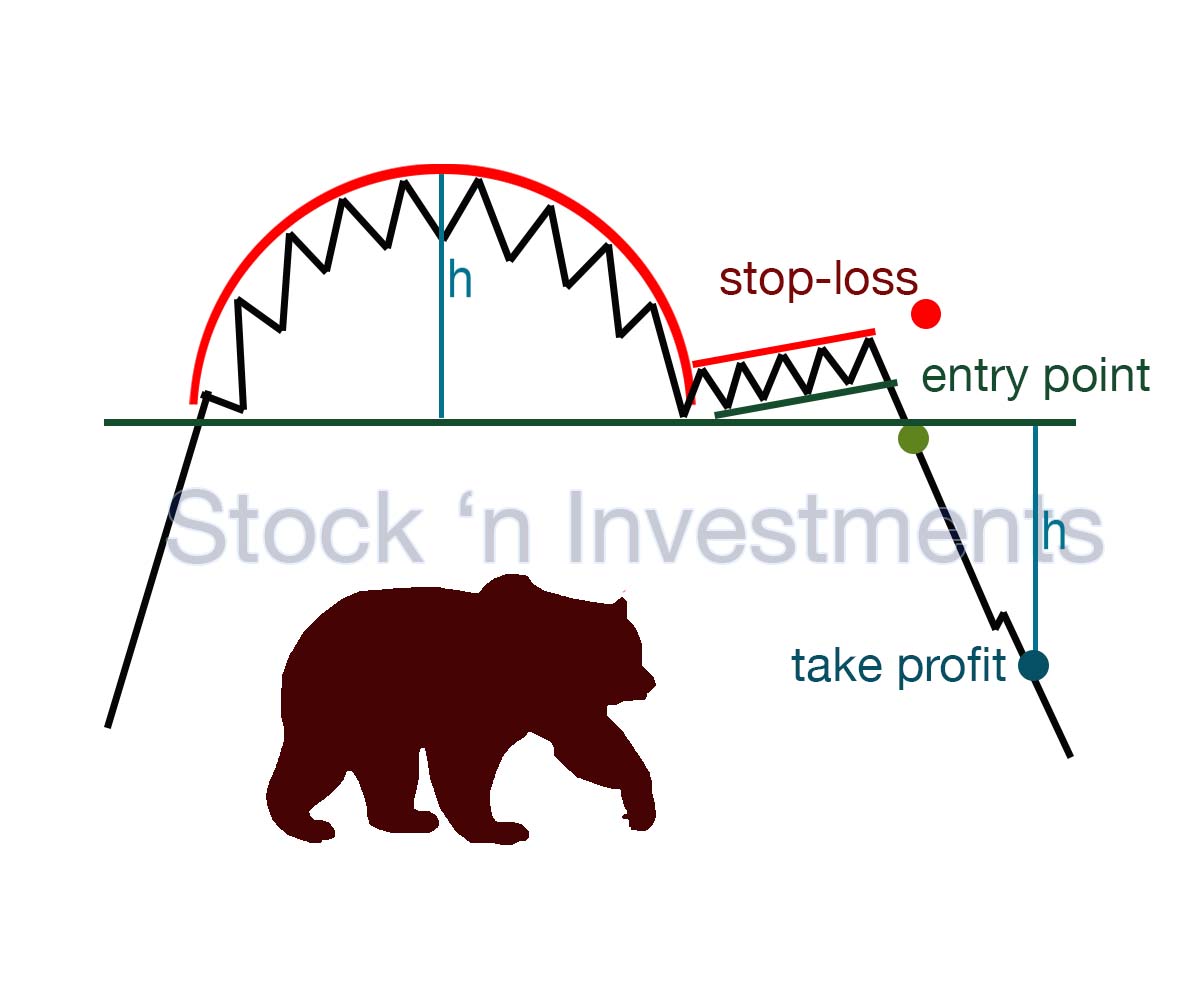
In reverse cup with handle, the price initially experiences a significant upward movement, forming the left side of the formation resembling a cup. This is followed by a retracement or consolidation phase, creating the “handle” portion of the pattern, which is characterized by relatively lower trading volumes.
Traders often look for a breakout below the support level of the handle to confirm the pattern’s validity. This breakout indicates a potential reversal of the prior uptrend and a continuation of the bearish momentum.
The target price projection for the inverse cup with handle price formation is calculated by measuring the distance from the peak of the cup to the bottom of the handle, and then extending that distance downwards from the breakout point. This provides traders with an estimate of the potential price decline following the pattern’s confirmation.
Overall, the upside down cup and handle formation serves as a signal for traders to anticipate a bearish trend reversal and consider short-selling or exiting long positions to capitalize on potential downward price movement. As with any technical pattern, traders should use additional analysis and risk management techniques to validate their trading decisions.
Cup and handle formation failure
A cup and handle pattern failure occurs when the anticipated breakout from the handle portion of the pattern does not materialize as expected. This can happen for various reasons, including lack of sufficient buying interest, market manipulation, or changing market conditions. Traders should be prepared to manage risk and exit positions if the pattern fails to confirm, preventing potential losses.
Cup and handle meaning in stock
The cup and handle pattern in stocks is a bullish technical chart formation that typically signals a potential continuation of an uptrend. Traders often interpret this pattern as a sign of accumulation. And expect the price to move higher after the handle formation is completed. It’s considered a bullish signal when the price breaks out above the resistance level formed by the handle.
What does cup and handle pattern look like?
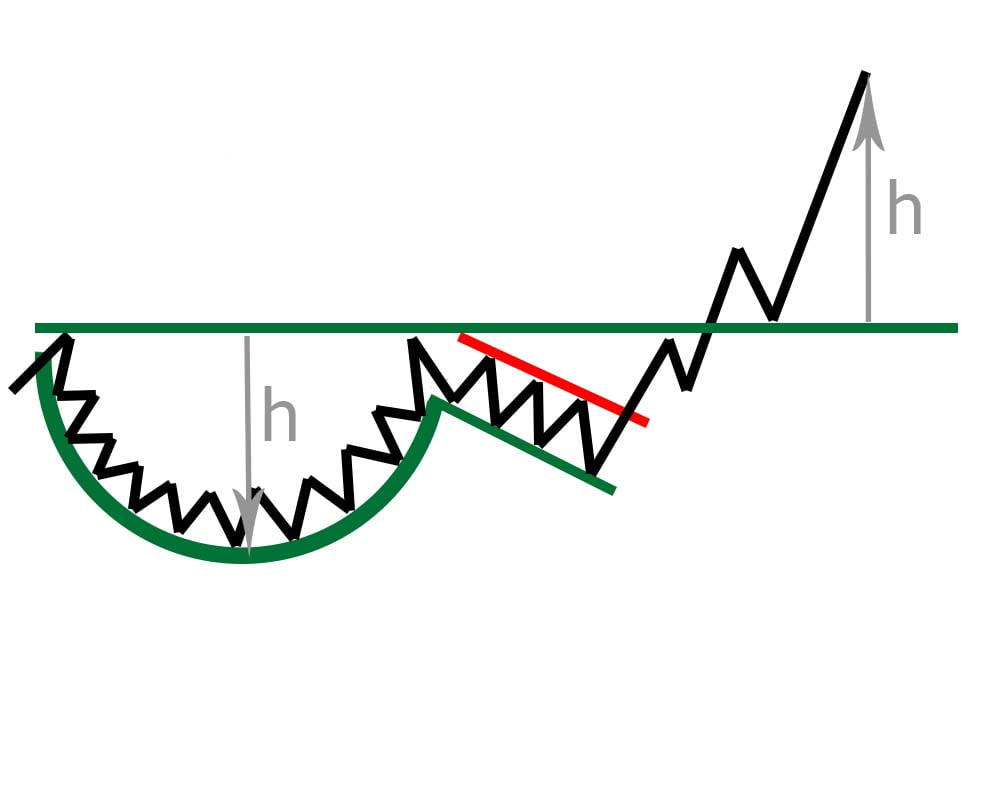
The cup and handle formation indeed resembles a cup with a handle. First, the cup shape is formed, followed by a slight price decline, typically about 30% from the depth of the cup. Afterward, trading volume begins to increase, along with the price. The entry point for a position is typically at the intersection of the resistance line and the price formation line.
How to trade cup and handle pattern?
If you observe the chart on the stock market or Binance, you may notice how the bottom curve is formed, with decreasing trading volumes. It seems like the price starts to rise. But when it reaches the resistance line, the increase turns into a slight decline. Trading volume further decreases. However, with the increase in trading volumes, the price begins to rise again. And the moment it crosses the resistance line is the entry point. It is most predictable that the rise will be approximately the distance from the bottom of the cup to the resistance line. This will be the exit point.
How often does the cup and handle formation occur?
The frequency of cup and handle formations can vary depending on the market conditions and the timeframe being analyzed. In general, cup and handle patterns are considered relatively rare compared to other chart patterns. However, they can still occur with some regularity, especially in markets with high liquidity and volatility. Such as certain stock markets or cryptocurrency exchanges.
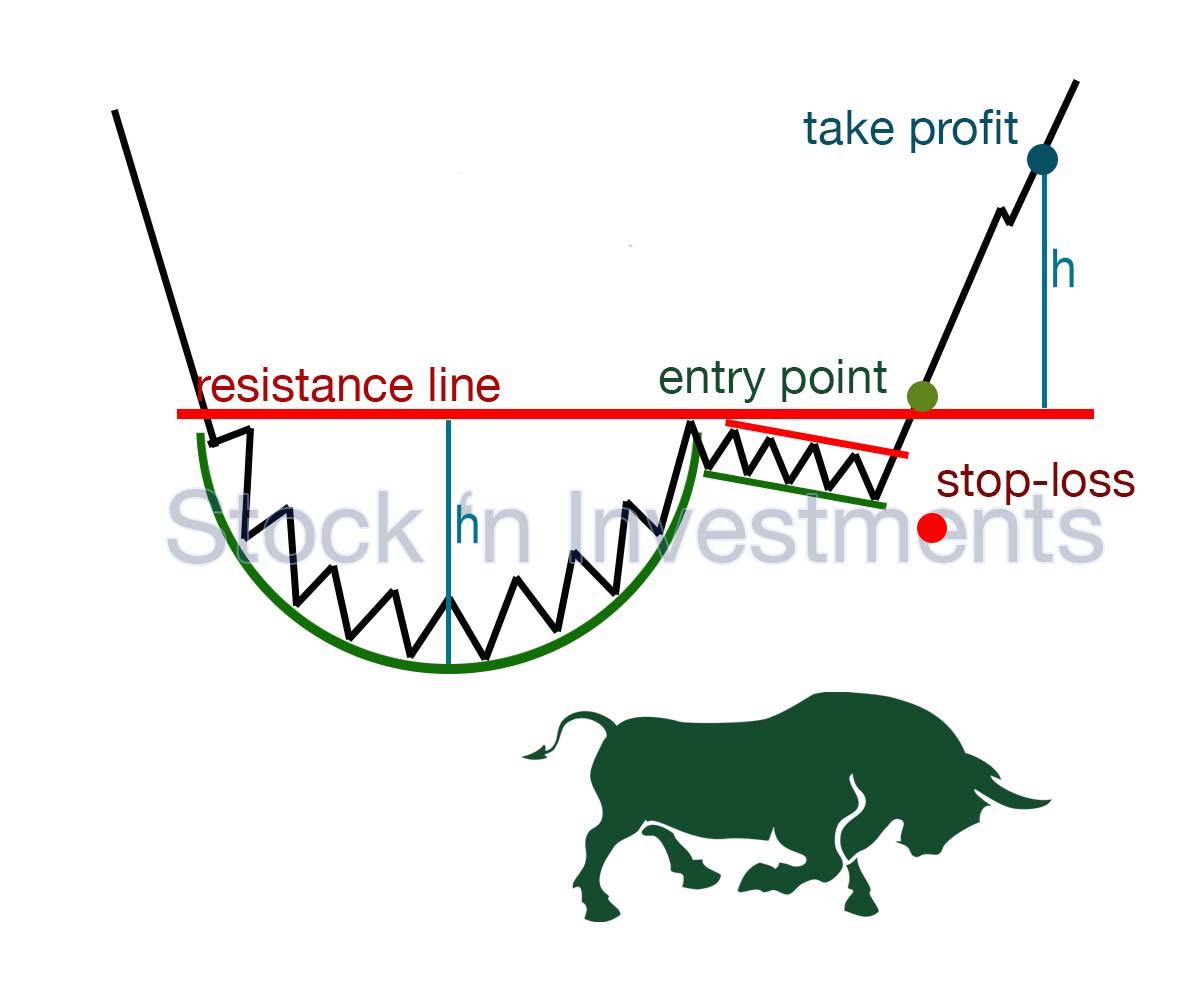
When entering a position in a cup and handle pattern?
When entering a position in a cup and handle pattern, traders typically wait for confirmation of the pattern’s validity before taking action. This confirmation usually occurs when the price breaks above the resistance line of the handle portion of the pattern. Additionally, traders may look for increasing volume during the breakout to further confirm the strength of the move. The entry point is often near the breakout level or slightly above it to ensure participation in the upward momentum.
When to exit a position in a cup and handle formation?
When exiting a position in a cup and handle formation, traders often consider several factors to determine the optimal time to sell:
- traders may set a target price based on the height of the cup formation. This target price is typically calculated by measuring the distance from the bottom of the cup to the resistance line and adding it to the breakout level
- monitoring trading volume can provide valuable insights. If volume begins to decrease as the price approaches the target or if it remains stagnant, it may indicate weakening momentum and could be a signal to consider exiting the position
- traders typically use technical indicators such as moving averages, relative strength index (RSI), or MACD (Moving Average Convergence Divergence) to confirm the strength of the trend. Reversal signals from these indicators, such as bearish divergences or overbought conditions, could prompt traders to exit their positions
- watching for signs of a reversal or loss of momentum in price action is crucial. If the price fails to break above the expected resistance level or starts to show signs of weakness, it may be prudent to exit the position to lock in profits or minimize losses
- traders regularly use stop-loss orders to automatically exit their positions if the price moves against them beyond a certain threshold. This helps limit potential losses and protects profits.
Can the cup and handle pattern be used on cryptocurrency markets?
Yes, the cup and handle pattern can be used on cryptocurrency markets just like it can be applied to traditional financial markets such as stocks. In fact, due to the high volatility of cryptocurrency markets, the cup and handle formation may occur more frequently and potentially with greater magnitude in crypto trading.
What guarantee is there that the price will rise after the formation of this pattern?
There is no guarantee that the price will rise after the formation of the cup and handle formation. While the cup and handle pattern is considered a bullish continuation pattern and often indicates a potential upward price movement, it is not foolproof.
Conclusion
Trading the cup and handle formation involves identifying the formation on a price chart, confirming its validity, and executing trades based on the pattern’s rules. Traders typically look for buying opportunities as the price breaks out of the handle portion of the pattern, indicating potential upward momentum. Risk management strategies are crucial when trading this pattern to minimize losses in case of false breakouts or reversals.
Pingback: Stock Market Patterns Bulls & Bears
Pingback: Stock Market Patterns, 12 options Stock 'n Investments