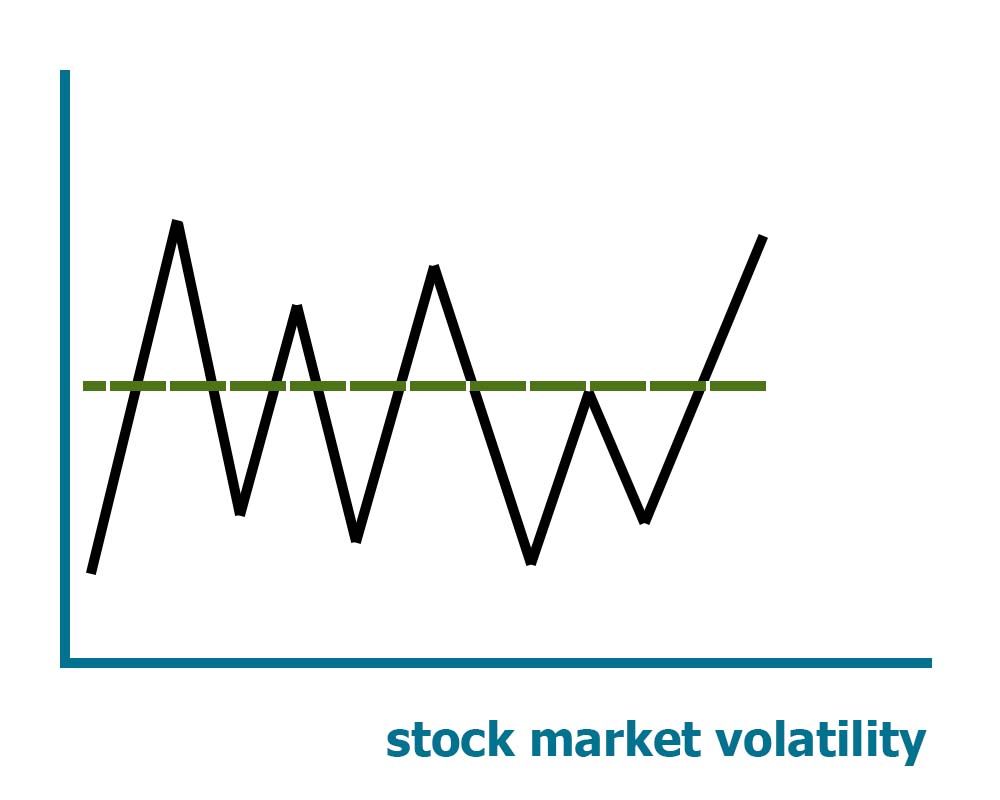
Stock market volatility refers to price fluctuations over a period, evoking both excitement and fear among investors. While rapid price changes attract attention, they can lead to significant losses. While some investors see volatility as an opportunity, it’s crucial to recognize its risk. Being prepared for various scenarios and developing a clear risk management plan are key steps for those engaging in market trading.
Volatility is measured using the standard deviation method or by the variance of returns.
Causes of Stock Market Volatility
One of the reasons for volatility is external events such as economic crises, force majeure situations, or significant announcements from companies or competitors. These events can abruptly alter market perception and trigger intense investor activity.
Moreover, experienced traders may artificially create market movements by directing buying and selling activity for personal gain. This can lead to rapid and unexpected price fluctuations, which may be advantageous for some investors but pose risks for others.
Volatility also depends on various internal factors, such as the size and stability of the company, the sector of the economy it belongs to, and the country in which it operates. The more stable and well-known a company is, the less volatile factors influence it.
Meaning Volatility in Finance
Volatility plays a key role in shaping investment strategies and determining their outcomes. On one hand, it can be a source of significant profits, but on the other hand, it entails high risk. Higher volatility indicates greater risk and can lead to sudden losses or gains. This means investors must be prepared for unpredictable price fluctuations. However, high volatility can also present opportunities for higher profits, albeit requiring investors to embrace risk.
One method of risk management is diversification. This strategy involves spreading investments across different types of assets. Diversification helps reduce the impact of volatility on the overall portfolio performance, since losses in one asset can be offset by gains in another. It allows balancing risks and ensuring more stable results in the face of market volatility.
Stock Market Volatility: Define Market Volatility
Define volatility is a request for a definition of the term “volatility,” which refers to the degree of variation or fluctuation in the price or value of a financial instrument over time.
Volatility is expressed through standard deviation or return dispersion. The higher the volatility, the greater the risk associated with the instrument. Typically, volatility is measured based on the difference in returns over the same period of time. Here are some examples of how volatility can be considered:
- Large fluctuations in the stock market: When the stock market rises and falls by more than 1% over an extended period, it is considered volatile.
- Stock price volatility: Sharp changes in the price of a company’s stock indicate high volatility of those stocks.
- Options volatility: Volatility is a key factor in options pricing, as it affects the option’s price.
- Implied volatility: Measures how volatile the market will be in the future.
- Historical volatility: Measures price changes over certain predictable periods of time.
How to determine historical volatility?:
We have the values of the stock prices on the end date of each month.
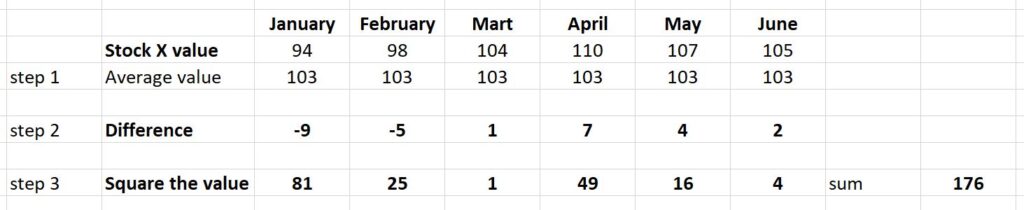
- Let’s calculate the average value of the stock price.
- Let’s subtract the value of the stock from the average value.
- Let’s square the difference of the values and add.
- We’ll divide the obtained values by the number of months 176/6 = 29,33
- We’ll take the square root of the obtained values. Standard deviation is 5,41.
Implied Volatility in Stock Markets
Implied volatility is a forward-looking measure used by investors to predict potential price movements of securities, particularly in options trading. Unlike historical volatility, which looks at past price fluctuations, implied volatility focuses on future expectations without relying on historical data.
Options Volatility in Stock Markets
Options contracts come in two varieties: call and put. With a call option, investors have the right to buy stocks at a predetermined price (strike price) before the contract expires. Conversely, with a put option, investors have the right to sell stocks at a specified price before the contract expires. The pricing of options contracts relies heavily on the implied volatility of the underlying security.
Understanding volatility helps investors and traders make informed decisions about risks and potential returns.
Stock Volatility Index (VIX Stock)
Investor sentiment plays a crucial role in determining market volatility, as reflected in the Volatility Index (VIX), established by the Chicago Board Options Exchange. A high VIX suggests a market perceived as risky and unpredictable, while a low VIX indicates relative stability and confidence among investors.
Meaning of Beta in Finance
Beta is a measure of stock volatility that indicates the relationship between a stock’s value and its relevant market index. It quantifies how much a stock’s price tends to move in relation to changes in the index. For example, a beta of 1.2 means that the stock is likely to move 20% more than the index, while a beta of 0.8 proposes it will move 20% less. Higher beta values signify stronger correlation with the index and greater market dependency, indicating higher volatility.
Stock Market Volatility Smirk
A volatility smirk is a visual pattern formed by plotting the implied volatility against the strike price of multiple options contracts with the same underlying asset and expiration date. It resembles a smile because implied volatility initially decreases as the underlying asset moves away from the strike price, reaching a minimum at the at-the-money point, and then increases. This indicates that options contracts have the lowest implied volatility when they are at the money, where the strike price matches the market value of the underlying asset.
Define Volatility in Economics
Volatility in economics refers to the degree of variation or fluctuation in the value of an economic variable over time. It indicates the degree of uncertainty or risk associated with changes in prices, output, or other economic indicators within a certain period. Higher volatility suggests greater unpredictability and risk in economic conditions, while lower volatility indicates more stability and predictability.
Example of Volatility in Stock Markets
An example of volatility in economics could be the fluctuation in the prices of commodities such as oil or gold. For instance, if the price of oil experiences rapid and unpredictable changes over a short period, it reflects high volatility in the oil market. This volatility can be influenced by various factors such as geopolitical tensions, changes in supply and demand dynamics, or macroeconomic indicators.
Idiosyncratic Volatility
Idiosyncratic volatility pertains to individual assets, not broader market factors’ influence. It represents the fluctuations in the price of a particular stock or asset that are not correlated with the overall market movements. Idiosyncratic volatility can be influenced by company-specific factors such as earnings reports, management changes, or product developments.
Pingback: Alternative Assets: 10 options - Stock 'n bulls
Pingback: Alternative Investment Partners - Stock 'n bulls
Pingback: Cup and Handle Formation in Reality - Stock 'n Investments
Pingback: Alternative Investment Partners: Vital Role - Stock 'n Investments
Pingback: Alternative Assets: 10 options - Stock 'n Investments
Pingback: Bull Flag Pattern Trading: Strategies, Tips and Techniques - Stock 'n Investments
Pingback: Falling Wedge Pattern: Technical Analysis & Analytics - Stock 'n Investments