A bull flag pattern is a key chart pattern in technical analysis that signals the continuation of an uptrend. It’s one of stock market patterns. It has two main parts: the flagpole and the flag.
Flagpole. This is the initial, sharp upward price movement, showing strong buying interest and momentum.
Flag. Following the flagpole, there’s a period where the price consolidates or slightly pulls back, forming a small rectangle or parallelogram. This section typically slopes downwards or moves sideways, indicating a pause in the trend rather than a reversal.
Key features of the bull flag pattern
Upward flagpole. This represents a strong bullish move.
Consolidation flag. This shows a short period where traders are taking profits or the market is catching its breath before potentially moving higher.
How to trade the bull flag pattern
Spot the flag. Look for a strong, sharp rise in price that forms the flagpole. After the flagpole, there will be a brief consolidation period where prices form a small, downward-tilting rectangle or parallelogram.
Confirm the pattern. Make sure the flag is just a short break and not the start of a long decline. It should be a brief pullback after a strong upward move.
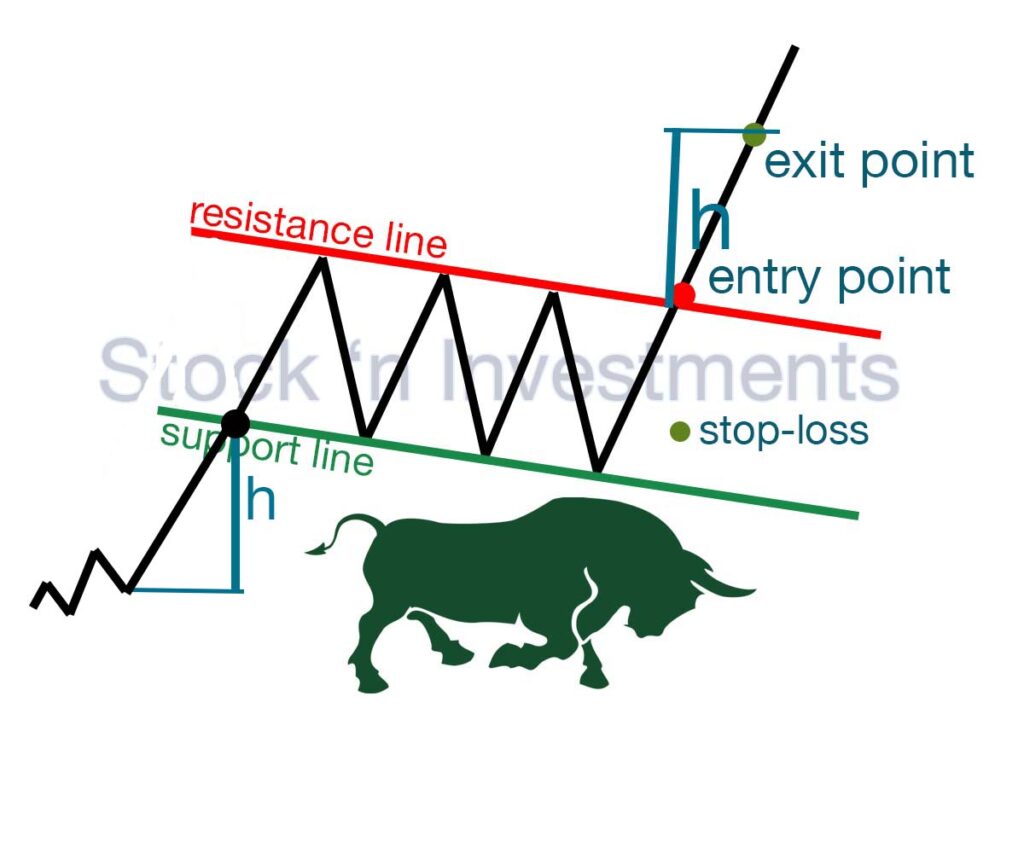
Determine the entry point. Plan to enter the position just above the upper boundary of the flag. This means you buy when the price breaks above this level, confirming the upward trend is resuming.
Check the breakout. Look for increased trading volume during the breakout. This volume spike confirms that the price is likely to continue moving up.
Set a stop-loss. To protect against unexpected price drops, set a stop-loss just below the lower boundary of the flag. This minimizes your risk.
Set a target. You can set your target by measuring the length of the flagpole and adding this to the breakout point.
How can I avoid missing a breakout in a bull flag pattern and enter a position in a timely manner?
Monitor charts regularly. Check the asset’s charts frequently to avoid missing the breakout moment.
Use alerts. Set alerts on your trading platform or mobile app to notify you automatically when the price approaches the breakout level.
Trading strategies. Use automated trading strategies or bots that can buy the asset when the price reaches a predetermined level.
Analyze trading volume. Watch for a sharp increase in trading volume, as this can indicate an imminent breakout.
Apply technical indicators. Utilize indicators like Moving Averages, RSI (Relative Strength Index), or MACD (Moving Average Convergence Divergence) to identify when the asset is nearing a breakout.
Place breakout orders. Place limit orders slightly above the upper boundary of the bull flag pattern to automatically enter a position when the breakout occurs.
Analyze other factors. Keep an eye on news and events that could affect the market and lead to a breakout.
What happens to the trading volume in a bull flag pattern?
Before the flag (flagpole)
Initially, there is a sharp increase in price, accompanied by a significant rise in trading volume. This indicates strong interest from buyers.
During the formation of the flag
After the initial rise, the price starts to consolidate within a narrow range, forming a shape that resembles a flag. During this period, trading volume decreases, indicating a temporary pause in market activity.
After the flag breakout
When the price breaks out above the upper boundary of the flag, trading volume increases significantly again. This confirms the breakout and indicates renewed buying interest.
How is it most effective to exit a position in a bull flag pattern?
For this, it is worth using some strategies.
Profit targets. Set a profit target based on the measured move technique. Calculate the height of the flagpole (the initial sharp upward move) and project that distance from the breakout point of the flag. This gives an estimate of the potential upside.
Trailing stop. Use a trailing stop to lock in profits as the price continues to move in your favor. Adjust the stop loss to trail the price at a certain percentage or dollar amount below the current price, allowing you to capture gains while protecting against reversals.
Volume analysis. Monitor trading volume in the bull flag pattern. A significant drop in volume or a spike in selling volume can indicate a weakening trend and a potential reversal, signaling a good time to exit.
Technical indicators. Use technical indicators like the Relative Strength Index (RSI) or Moving Averages to identify overbought conditions or potential trend reversals. Exiting when these indicators signal overbought conditions can help preserve gains.
Support and resistance levels. Identify key support and resistance levels. If the price approaches a strong resistance level or breaks below a support level, it may be an indication to exit the position.
Time-based exit. In some cases, setting a time-based exit can be effective. If the price does not reach your target within a certain period, it might be wise to exit and reassess the market conditions.
Where is it best to set the stop-loss in a bull flag pattern?
Setting the stop-loss in a bull flag depends on various factors, including the trader’s risk tolerance, market conditions, and the specific characteristics of the pattern. However, a common approach is to place the stop-loss below the lowest point of the flag portion of the pattern. This level typically represents a significant support area, and if the price breaks below it, it may indicate a potential trend reversal. By placing the stop-loss below this level, traders aim to limit their potential losses while allowing the trade enough room to breathe within the pattern’s structure. Additionally, some traders may adjust the stop-loss dynamically as the trade progresses, using techniques such as trailing stops to protect profits or minimize losses.
Where is it best to place the trailing stop in a bull flag pattern?
A common approach is to set the trailing stop just below the rising trend line of the flag portion of the pattern. This trend line often acts as dynamic support, and if the price breaks below it, it may signal a potential trend reversal. By placing the trailing stop below this trend line, traders aim to capture profits while allowing the trade to remain open as long as the bullish momentum persists. Additionally, some traders may adjust the trailing stop dynamically as the trade evolves, trailing it higher as the price moves in their favor to protect profits and minimize potential losses.
What timeframes are best suited for using the bull flag formation?
The bull flag can be utilized effectively across various timeframes, but it is commonly observed and traded on shorter timeframes such as intraday charts (e.g., 15-minute, 30-minute) and daily charts. However, its validity and reliability can also extend to longer timeframes like weekly or monthly charts. Traders often adjust their strategies based on the timeframe they are trading and the level of price volatility they are comfortable with.
How often does a false breakout occur in the bull flag pattern?
The frequency of false breakouts in the bull flag can depend on various factors such as market volatility, market trend, and the time frame being analyzed. In more stable conditions or on markets with low volatility, false breakouts may be less common since prices typically move more predictably. However, in high volatility conditions or during strong price movements, false breakouts may become more frequent.
Is it advisable to enter a position in the formation during high volatility?
Entering a position in the bull flag pattern during high volatility can be riskier due to increased price fluctuations. It’s essential to consider the potential impact of heightened volatility on your trading strategy and risk tolerance. While some traders may seek opportunities in volatile markets, others may prefer more stable conditions for trading bull flag patterns. It ultimately depends on your individual trading style and risk management approach.