A bear flag pattern is a technical analysis chart pattern that indicates a continuation of a downtrend in the market. It forms when the price of a security declines sharply, then consolidates slightly higher in a small upward-sloping channel or rectangle, resembling a flag on a pole. It is one of stock market patterns.
Bear flags are used by traders to identify potential short-selling opportunities. In bear flag trading, traders look for the price to break down from the consolidation phase, signaling a continuation of the previous downtrend. The bear flag trading pattern is characterized by a strong initial decline (the flagpole), followed by a brief period of consolidation (the flag), before the price resumes its downward movement.
When analyzing a bear flag chart pattern, traders pay close attention to the volume. Ideally, volume should decrease during the consolidation phase and increase again when the price breaks below the lower boundary of the flag, confirming the continuation of the downtrend.
Bear flags are often seen in bear markets or during periods of significant selling pressure. A related pattern is the bear pennant pattern, which also indicates a continuation of a downtrend but has a triangular consolidation phase instead of a rectangular one.
Key characteristics of a bear flag pattern
The pattern begins after a strong and steep decline in price, known as the flagpole. This initial drop indicates bearish sentiment. Following the sharp decline, the price consolidates in a small upward or sideways channel, forming the flag. This consolidation phase typically shows weaker volume compared to the decline. The pattern is confirmed when the price breaks out of the consolidation phase to the downside, continuing the original downtrend.
Identify and trade the bear flag formation
- Identify the Flagpole
- Spot the Flag
- Wait for the Breakdown
- Set Entry and Exit Points
In which point to enter a position in a bear flag pattern?
Example
Flagpole. The price drops from $100 to $80.
Flag. The price consolidates between $80 and $85, forming the flag.
Breakdown. The price breaks below the lower boundary of the flag at $80.
Specific steps for entry
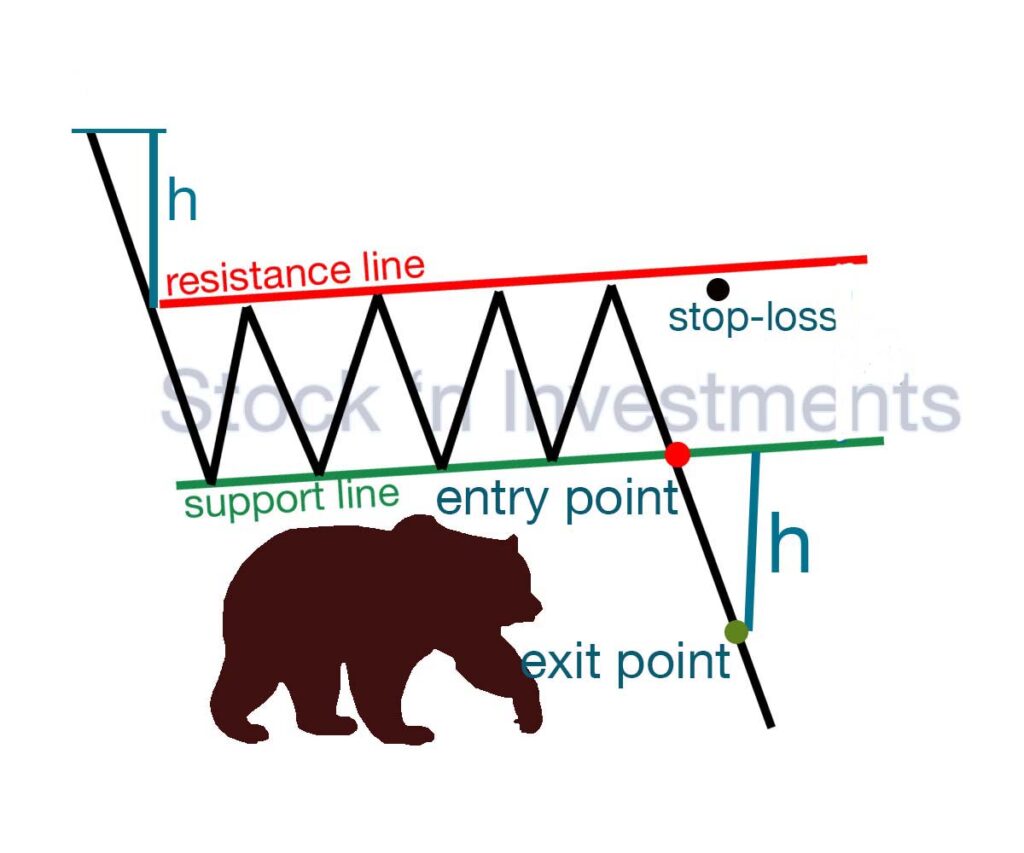
Entry point. Enter a short position at $79 or slightly lower, after confirming the break below the lower boundary of the flag in bear flag pattern.
Stop-loss. Set a stop-loss slightly above the upper boundary of the flag, for example, at $86. This helps limit losses in case of an adverse price movement.
Target level. Determine the target level for exiting the position using the length of the flagpole. For example, if the flagpole is $20 (from $100 to $80), the target level would be $60 (i.e., $80 – $20).
Where is the exit point in a bear flag pattern position?
The exit point in the pattern is determined based on the length of the flagpole and the overall market conditions.
Example
The flagpole length is measured as the distance from the initial drop point to the start of the flag. For example, if the price dropped from $100 to $80, the flagpole length would be $20.
After the price breaks below the lower boundary of the flag, project the flagpole length downward to determine the target exit point. In our example, with a flagpole length of $20, if the breakdown occurred at $80, the target level would be $60 (i.e., $80 – $20).
How does trading volume change in a bear flag pattern?
Flagpole. During the flagpole phase, trading volume typically increases significantly. This indicates strong momentum and high selling activity, leading to a sharp price drop. High trading volume during this period confirms the strength of the trend.
Flag Formation (Consolidation). During the formation of the flag, trading volume usually decreases. This indicates a temporary weakening of momentum and a reduction in trading activity. The price consolidates or moves sideways, forming the flag. The decrease in trading volume during consolidation is typical for a bear flag pattern.
Breakdown. When the price breaks below the lower boundary of the flag, trading volume typically increases again. This confirms the continuation of the downtrend and the resurgence of selling momentum. The increase in trading volume during the breakdown is an important signal for pattern confirmation.
What technical indicators are best to use in a bear flag pattern?
Moving Averages (MA). Helps determine the trend direction and its strength. Price crossing with EMA can confirm the bear flag chart signal.
Relative Strength Index (RSI). It can indicate overbought or oversold market conditions. Decrease in RSI during flag formation and increase during breakdown can confirm the pattern.
Volume indicator. Trading volume can be crucial in analyzing the bear flag pattern. Changes in volume from period to period can confirm pattern signals, especially during flag breakout.
MACD. It can help identify price direction change signals and confirm bear flag formation signals.
Bollinger Bands. Using Bollinger Bands can help determine whether the price is oversold or overbought and establish potential entry and exit points for positions.
How to use a trailing stop in a bear flag trading pattern?
To effectively use a trailing stop, you need to follow these steps:
Selecting an initial stop-loss level. Set an initial stop-loss level on the position that will help protect your capital in case the pattern fails to follow through. For example, this could be a stop-loss level positioned slightly above the upper boundary of the flag.
Adjusting the trailing stop. As the price moves in your favor and you see the pattern continuing, regularly move the stop-loss level upward along with the price. For instance, you can trail the stop-loss at a certain distance behind the price, thus increasing your protected profit portion in a bear flag pattern.
Calculating distance for trailing stop. You can use various approaches to determine the distance for the trailing stop, such as a fixed distance from the current price or a percentage distance. For example, you can set the trailing stop at a distance of 1 or 2 ATR (Average True Range) from the current price.
Constant monitoring of the position. It’s crucial to continuously monitor the price movement and corresponding changes in the trailing stop level. Adjust your stop-losses as needed to align with current market conditions and pattern changes.
Exiting the position: When the trailing stop reaches a certain level, it’s time to close the position. This may be a sign that the bear flag trading pattern is no longer valid or that the market is turning against you.
Conclusion
In summary, bear flag stock patterns are essential tools for traders looking to capitalize on downward market movements.