Mastering bull & bear flag pattern trading can significantly enhance your ability to predict market trends and make informed trading decisions. Flag patterns can be powerful tools for trading in trending markets. By understanding their formation and using proper entry, stop-loss, and profit target strategies, traders can effectively capitalize on these patterns.
Bull flag pattern trading
Imagine we are analyzing the stock of XYZ Company, which has recently experienced a sharp rise. The price jumped from $50 to $70, forming the flagpole. After this, the price stabilized and began to fluctuate between $68 and $66, forming the flag.
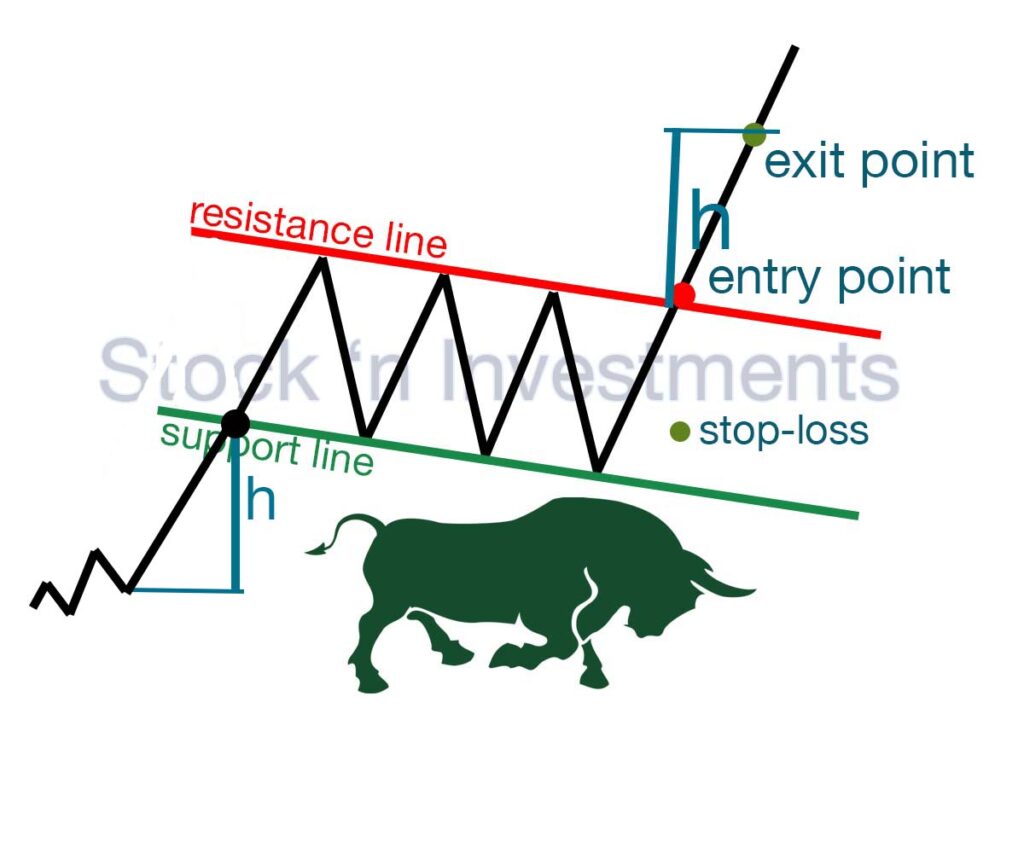
Entry point
When the stock price breaks above the upper boundary of the flag ($68) with increased trading volume, this is a signal to open a long position. You might enter at $68.50 to confirm the breakout in flag pattern trading.
Stop-loss
Place the stop-loss slightly below the lower boundary of the flag to limit potential losses. For example, if the lower boundary is at $66, set the stop-loss at $66.50 in bull flag pattern.
Take-profit
Measure the height of the flagpole (from $50 to $70), which is $20. Add this amount to the breakout point ($68.50 + $20 = $88.50). Set your profit target at $88.50.
Bear flag pattern trading
Suppose we are analyzing the stock of the company ABC, which recently experienced a sharp decline. The price fell from $100 to $70, forming the flagpole. After this, the price stabilized and began fluctuating between $72 and $74, forming the flag.
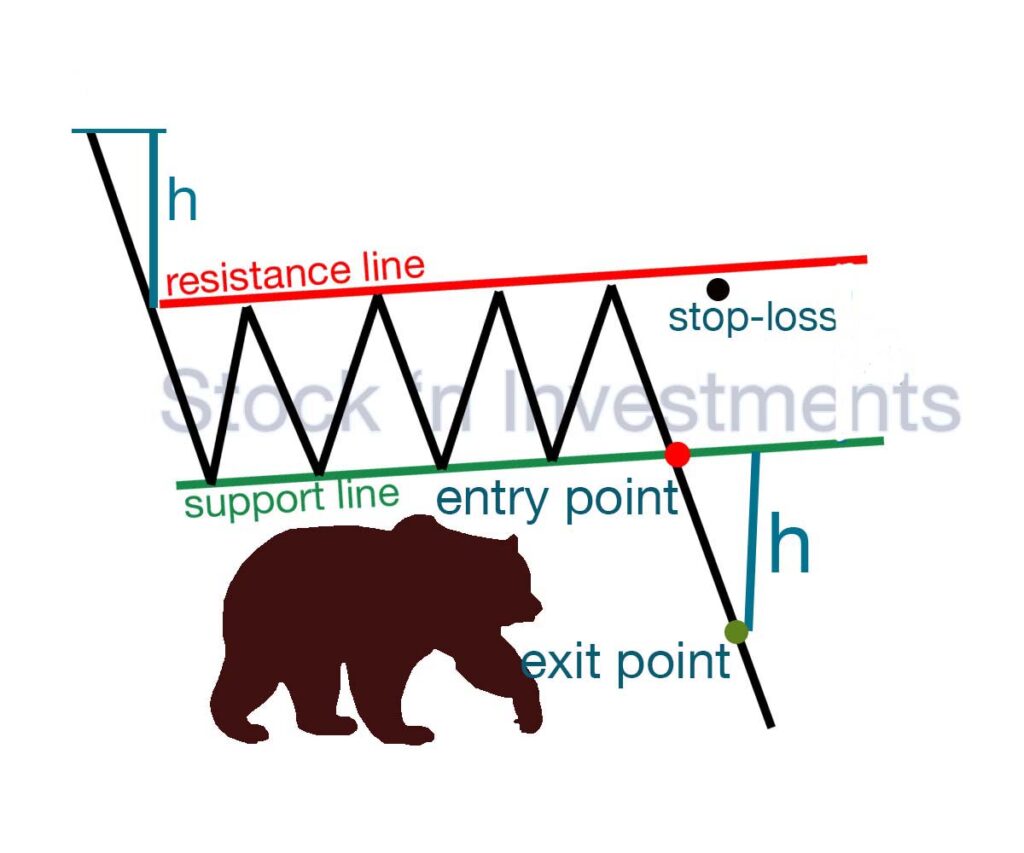
Entry point
When the stock price breaks below the lower boundary of the flag ($72) with increased trading volume, this is a signal to open a short position. You might enter at $71.50 to confirm the breakout in flag pattern trading.
Stop-loss
Place the stop-loss slightly above the upper boundary of the flag to limit potential losses. For example, if the upper boundary is at $74, set the stop-loss at $74.50 in bear flag pattern.
Take-profit
Measure the height of the flagpole (from $100 to $70), which is $30. Subtract this amount from the breakout point ($71.50 – $30 = $41.50). Set the profit target at $41.50.
What are the tips for successful bull & bear flag pattern trading?
- Ensure the breakout is accompanied by a significant increase in trading volume. This confirms the strength of the move.
- Always use stop-loss orders to minimize losses. This is crucial for protecting your capital.
- The bull & bear flag pattern is a continuation of an uptrend. Make sure the market is in a strong trend before trading this pattern.
- Check the pattern on different timeframes to confirm its validity and avoid false signals.
What are the key indicators to watch for in flag pattern trading?
Key indicators to watch for include (bull flag pattern or bear flag pattern without difference):
- Volume
- Trendlines
- Price Action
- Moving Averages
- Relative Strength Index (RSI)
How does volume influence the reliability of flag pattern trading signals?
Volume is super important when trading flag patterns because it helps you figure out if a breakout is real or just a head fake.
Confirming breakouts. If you see a bull flag pattern, you want to see a spike in volume when the price breaks above the flag’s upper trendline. That spike in volume means a lot of buyers are jumping in, and the uptrend is likely to continue. For a bear flag pattern trading, look for increased volume when the price breaks below the flag’s lower trendline. Higher volume here means sellers are strong, and the downtrend is likely to keep going.
Spotting weak breakouts. If a breakout happens with low volume, be cautious. Low volume means there might not be enough momentum behind the move, and it could reverse or just fizzle out.
Understanding trend strength. When the flag is forming, volume usually decreases. This drop is normal and shows the market is taking a breather before the next move. But for the breakout to be credible, you need to see volume pick up again.
Reading market sentiment. High volume during a breakout is a good sign of strong market sentiment. It shows a lot of traders are on board, which adds confidence to the breakout’s strength.
What are common mistakes to avoid in flag pattern trading?
Ignoring volume confirmation. One of the biggest mistakes is not paying attention to volume. A valid flag pattern breakout should be accompanied by a significant increase in volume. Low volume can indicate a false breakout.
Entering too early. Jumping into a trade before the breakout is confirmed can be risky. Ensure that the price clearly breaks above the upper trendline (for a bullish flag) or below the lower trendline (for a bearish flag) before entering a position.
Setting stop-loss orders incorrectly. Poorly placed stop-loss orders can lead to unnecessary losses. Stop-loss should be set just outside the flag pattern trading to avoid being stopped out by normal market noise.
Ignoring the overall trend. Flags are continuation patterns, so they should form in the context of an existing strong trend. Trading flag patterns in a choppy or sideways market can lead to false signals and losses.
Misidentifying the pattern. Confusing flag patterns with other similar patterns like pennants or wedges can lead to incorrect trading decisions. Make sure the pattern fits the criteria of a flag: a strong directional move (the flagpole) followed by a parallel consolidation channel (the flag).
Overtrading. Seeing patterns that aren’t there or trading every perceived flag can lead to overtrading. Stick to high-probability setups and ensure the pattern is well-defined before taking a trade.
More mistakes…
Neglecting risk management. Failing to manage risk properly is a common mistake. Use appropriate position sizing, set stop-loss orders, and stick to your risk management rules to protect your capital.
Forgetting to take profits. Having a clear profit target based on the height of the flagpole can help in taking profits at the right time. Holding on too long hoping for more can lead to giving back gains if the trend reverses in flag pattern trading.
Not adapting to market conditions. Market conditions can change rapidly. A pattern that looks promising in one market condition may not work in another. Be flexible and adapt your strategy as needed.
Lack of patience. Flag patterns can take time to develop. Rushing into a trade without waiting for the pattern to complete and confirm can lead to premature entries and losses.
What strategies can enhance success in flag pattern trading?
Enhancing success in flag pattern involves employing a combination of technical analysis, risk management, and disciplined trading strategies. Bull or bear flag pattern without difference.
Volume confirmation. Ensure that the breakout from the flag pattern is accompanied by a significant increase in volume. This confirms the strength of the breakout and reduces the likelihood of a false signal.
Waiting for the breakout. Be patient and wait for a clear breakout above the upper trendline (for bullish flags) or below the lower trendline (for bearish flags) before entering a trade. This helps confirm the continuation of the trend.
Using stop-loss orders. Place stop-loss orders just outside the flag pattern trading to protect against sudden reversals. For a bullish flag, set the stop-loss below the lower trendline of the flag. For a bearish flag, set it above the upper trendline.
Setting profit targets. Determine profit targets by measuring the height of the flagpole and projecting that distance from the breakout point. This gives you a realistic expectation for the trade’s potential.
Analyzing the overall trend. Ensure the flag pattern trading is forming within the context of a strong, existing trend. Flags are continuation patterns, so they work best when the underlying trend is clear and strong.
Combining with other indicators. Use other technical indicators to confirm the strength of the trend and the breakout. Indicators like moving averages, RSI, MACD, and trendlines can provide additional confirmation.
Time frame analysis. Look for flag patterns on multiple time frames to ensure the trend is strong across different periods. A flag pattern visible on both the daily and weekly charts, for example, can provide stronger confirmation.
More strategies…
Risk management. Manage your risk by using appropriate position sizing and adhering to a risk-reward ratio. A common ratio is 1:3, where potential rewards are at least three times greater than the risks.
Avoiding overtrading. Focus on high-quality setups and avoid trading every perceived flag pattern. Overtrading can lead to unnecessary losses and increased transaction costs.
Monitoring market conditions. Stay informed about broader market conditions and news events that could impact your trades. External factors can influence the success of technical patterns.
Keeping a trading journal. Maintain a journal to record your trades, including entry and exit points, reasons for taking the trade, and the outcome. Reviewing your trades can help you learn from mistakes and improve your strategy.
Adapting to market changes. Be flexible and willing to adjust your strategy based on changing market conditions. What works in a trending market might not work in a sideways or highly volatile market.
How does market volatility impact flag pattern trading? (Practical example)
Market volatility can significantly impact in various ways.
- Suppose a trader identifies a bullish flag pattern in a stock during a period of high market volatility. Normally, they might expect a breakout above the flag to signal a continuation of the uptrend. However, due to volatility, the stock experiences sharp up and down moves, making it hard to identify a clear breakout in flag pattern trading.
- The trader decides to wait for additional confirmation, such as a volume spike or a moving average crossover, before entering the trade. They also set a wider stop-loss to account for larger price swings and reduce their position size to manage risk better. Despite the potential for higher rewards, the trader aims for a more conservative profit target to ensure they lock in gains amidst the volatility.
Can flag pattern trading be applied to all types of financial markets?
It applied to bull flag pattern and bear flag pattern.
Stock market
- Effectiveness: Flag patterns are commonly used and generally effective in the stock market. They can signal strong continuation moves after a period of consolidation.
- Approach: Traders look for flag patterns in trending stocks and use volume as a key confirmation indicator. Higher volumes on the breakout confirm the pattern’s reliability.
Forex market
- Effectiveness: Flag patterns can be effective in the forex market, especially during strong trends caused by economic news or geopolitical events.
- Approach: Forex traders often use flag patterns in conjunction with other technical indicators like moving averages and relative strength index (RSI) to confirm breakouts. Due to the 24-hour nature of forex, patterns can appear at any time, so traders need to monitor the market continuously.
Commodities market
- Effectiveness: Flag patterns are also applicable in the commodities market, particularly for highly traded commodities like gold, oil, and agricultural products.
- Approach: Traders may use flag patterns to capitalize on trends driven by supply and demand dynamics, geopolitical events, and seasonal factors. Volume plays a crucial role in confirming the breakout in commodities trading.
Cryptocurrency market
- Effectiveness: Flag patterns can be effective but are often less reliable due to the high volatility and speculative nature of the cryptocurrency market.
- Approach: Crypto traders need to be cautious and look for strong confirmation signals due to the market’s volatility. They might also use tighter stop-losses to manage risk effectively in flag pattern trading.
Bond Market
- Effectiveness: Flag patterns are less commonly used in the bond market because bond prices tend to be less volatile and more influenced by interest rate changes and economic policies.
- Approach: Traders might still look for flag patterns during periods of high volatility, such as when there are significant changes in interest rates or during major economic announcements.
Options market
- Effectiveness: Flag patterns can be used in options trading to identify potential price movements in the underlying asset.
- Approach: Traders might use flag patterns to inform their strategy, such as buying calls or puts based on the expected direction of the breakout. Due to the leverage involved, risk management is crucial in flag pattern trading.