Tag Archives: Rectangle Pattern

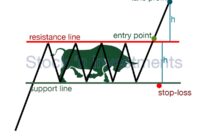
The rectangle pattern, also known as a trading range or consolidation pattern, is a technical analysis pattern that occurs when the price of an asset trades within a horizontal range or channel for an extended period. It represents a period of indecision or equilibrium between buyers and sellers, where neither group has enough strength to push the price decisively higher or lower.

Stock Market Patterns Trading: All Charts

By | July 21, 2024

If you’re seeking technical analysis of the stock market patterns, you’re likely a novice and eager to learn more. You’re on the right track. Successful trading requires knowledge of technical analysis patterns. This article compiles the main patterns used by professional traders. Each pattern includes a schematic representation and a brief description. Additionally, clicking on… Read More »