Tag Archives: Head and Shoulders Pattern

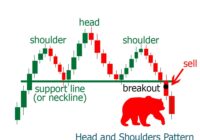
The Head and Shoulders Pattern is a widely recognized and reliable technical analysis chart pattern that signals a potential reversal in a trend. It is characterized by three peaks: a higher peak (head) between two lower peaks (shoulders). This pattern can appear in both uptrends and downtrends, with specific names and interpretations for each scenario.

Head and Shoulders Chart Pattern: Entry and Exit Points

By | July 14, 2024

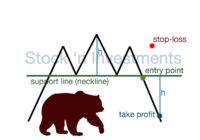
The head and shoulders chart pattern is a popular stock market patterns that signal a potential reversal in trend. There is the classic and the inverse head and shoulders, which indicates a bullish reversal in a downtrend when the price breaks above the neckline. For successful trading, it is essential to correctly determine entry and… Read More »
Stock Market Patterns Trading: All Charts

By | July 21, 2024

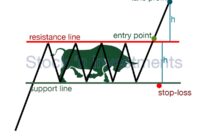
If you’re seeking technical analysis of the stock market patterns, you’re likely a novice and eager to learn more. You’re on the right track. Successful trading requires knowledge of technical analysis patterns. This article compiles the main patterns used by professional traders. Each pattern includes a schematic representation and a brief description. Additionally, clicking on… Read More »

Head and Shoulders Pattern: A Trader’s Guide to Spotting Trends

By | July 14, 2024

If you’re on the hunt for the head and shoulders pattern, you’re already on the path to mastering technical analysis! Dive into this article to unlock the secrets of this powerful pattern and elevate your trading game. By the time you reach the end, you’ll wield the H&S pattern like a pro. Armed with clear… Read More »