Double top pattern is a one of stock market patterns that signals a potential reversal of an upward trend. The pattern consists of two consecutive peaks at approximately the same level, with a trough in between.
- First peak. The price reaches a high level and starts to decline.
- Trough. The price drops to a certain support level.
- Second peak. The price rises again to the level of the first peak and then declines once more.
- Neckline break. The pattern is confirmed when the price breaks the support level (neckline) formed between the two peaks.
How to trade the double top pattern?
Trading the pattern involves identifying key points for entering and exiting trades.
Identification. Spot the two peaks at approximately the same price level with a trough in between. This indicates a potential double top.
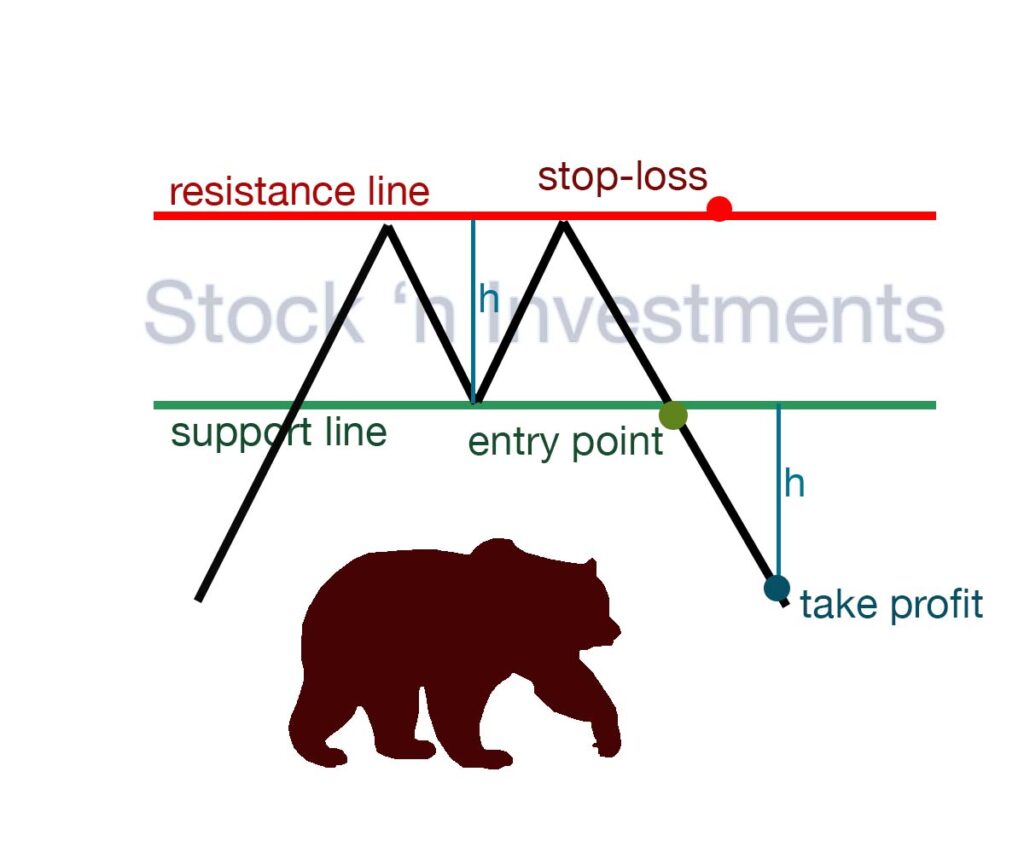
Confirmation. Wait for the price to break below the support level (neckline) formed by the trough. This confirms the pattern and signals a potential trend reversal.
Entry point. Enter a short position once the price breaks and closes below the neckline. This indicates a bearish trend continuation.
Stop-loss. Place a stop-loss order above the second peak to manage risk. This protects against unexpected price movements.
Take profit. Measure the distance from the neckline to the peaks and project this distance downward from the neckline break. This gives you a potential profit target in a double top pattern.
Example
Suppose ABC stock forms a double top at $50, with a trough at $45. When the price breaks below $45, you enter a short position. Set your stop-loss above the second peak at around $51. If the distance from the peak to the neckline is $5, your profit target would be $40 ($45 – $5).
What information does a double top pattern convey?
A double top typically indicates a potential reversal formation in an uptrend. It occurs when the price reaches a peak twice, followed by a decline after the second peak. This pattern suggests that the uptrend may be losing momentum and that a trend reversal to the downside could be imminent. Traders often interpret the double top chart as a signal to sell or to consider short positions, anticipating further price declines.
Why is a double top called a bearish pattern?
The double top is a bearish formation because it shows a failure to continue an uptrend, establishes a strong resistance level, confirms a trend reversal upon breaking the neckline, and often is accompanied by diminishing buying pressure. These factors combined signal to traders that the upward momentum has exhausted, and a downward trend is likely to follow.
Which technical indicators are best to use with the Double Top Pattern?
The most effective indicators to use:
- Volume
- Relative Strength Index (RSI)
- Moving Averages (MA)
- MACD (Moving Average Convergence Divergence)
- Stochastic Oscillator
- Bollinger Bands
- Fibonacci Retracement
How does the use of a trailing stop impact trading?
Using a trailing stop when trading the Double Top Pattern helps you manage risks more effectively, automatically protect profit, and reduce the emotional impact on decision-making. This can significantly increase the success of your trades, ensuring more stable results in the long term.
Benefits of a trailing stop
Protecting profit. A trailing stop allows you to automatically protect the profit you’ve already made. As the price moves in the desired direction (downward in the case of a Double Top Pattern), the trailing stop will automatically follow the price, locking in part of the profit.
Limiting losses. If the price suddenly reverses and moves against your position, the trailing stop will close the trade, limiting your losses. This is especially useful in highly volatile market conditions.
Automating the process. The trailing stop automatically adjusts without your intervention, eliminating the need to constantly monitor the market. This reduces stress and helps avoid emotional decisions.
What strategies can enhance the effectiveness of double top pattern trading?
- Ensure the second peak is accompanied by lower volume than the first peak, indicating weaker upward momentum.
- Combine the pattern with other technical indicators like RSI, MACD, or moving averages to confirm the reversal signal.
- Place a stop-loss above the second peak to manage risk if the pattern fails.
- Wait for the price to break below the neckline with increased volume before entering a trade to confirm the double top pattern.
- Measure the distance from the peaks to the neckline and subtract it from the breakout point to set a profit target.
- Consider the broader market context and any news or events that could impact price movements.
- Wait for clear confirmation of the pattern to avoid false signals and premature entries.
How does the volume change during pattern formation?
During the first peak. Volume is usually high as buyers actively push the price upward in a double top pattern.
Pullback from the first peak. Volume often decreases, indicating a short period of uncertainty or weakening buyer strength.
Rally to the second peak. Volume is generally lower than during the first peak, suggesting buyers lack the strength to create a new high.
Pullback from the second peak. If volume increases during the decline from the second peak, it can indicate market weakness and readiness for a downturn in the double top pattern.
Break of the neckline. Confirmation of the pattern is usually accompanied by an increase in volume as sellers become more active, confirming the strength of the bearish signal.
What are common mistakes to avoid in double top pattern trading?
Premature entry. Jumping into a trade before the pattern is fully confirmed can lead to losses if the pattern fails to materialize.
Ignoring volume. Volume can provide crucial confirmation for the pattern. Ignoring it or not paying attention to volume trends can be a mistake.
Overlooking timeframes. Double tops can appear differently on various timeframes. Ignoring this can lead to misinterpretation of the pattern’s strength.
Neglecting confirmation signals. Waiting for confirmation signals like a breakout below the neckline or a significant volume increase can prevent entering false signals.
Ignoring risk management. Failing to set stop-loss orders or risking too much capital on a single trade can lead to significant losses if the double top pattern fails.
Not considering market context. Market conditions and broader trends can affect the reliability of double top patterns. Ignoring these factors can lead to trading against the trend.
Confirmation bias. Seeing a double top where none exists due to confirmation bias can lead to entering trades based on false patterns.
What are the tips for successful double top pattern trading?
Wait for confirmation. Don’t enter a trade until the pattern is fully confirmed. This typically involves waiting for a breakdown below the neckline, accompanied by increased volume.
Identify a clear neckline. The neckline connects the lows between the two peaks of the double top. It should be a clear horizontal line or trendline that the price breaks below to confirm the pattern.
Consider volume. Volume should increase when the price breaks below the neckline. This confirms that selling pressure is strong and supports the validity of the double top pattern.
Target price calculation. Calculate the potential price target by measuring the distance from the neckline to the highest peak of the pattern. This distance can be projected downwards from the neckline after the breakdown.
Use stop-loss orders. Set a stop-loss order above the recent high of the second peak to protect yourself from significant losses if the pattern fails.
Confirm with other indicators. Use other technical indicators such as RSI (Relative Strength Index) or MACD (Moving Average Convergence Divergence) to confirm the bearish sentiment and potential reversal indicated by the double top pattern.
Consider market context. Evaluate the broader market context and trends. Double top patterns are more reliable when they occur after an uptrend, signaling a potential reversal.
Practice patience. Wait for the pattern to develop and confirm before entering a trade. Patience can help you avoid false signals and improve the reliability of your trades.
Risk management. Manage your risk appropriately by sizing your position and setting stop-loss orders according to your risk tolerance and the characteristics of the double top pattern.
In conclusion
In conclusion, the double top pattern is a significant bearish reversal pattern in technical analysis. Traders use it to identify potential trend reversals and plan their trading strategies accordingly. By recognizing the key elements and observing the breakout below the neckline, traders can capitalize on potential downward price movements in the market.
Pingback: Stock Market Patterns Bulls & Bears
Pingback: Essential Techniques for Trading Analysis - Stock 'n Investments
Pingback: Stock Market Patterns, 12 options Stock 'n Investments