If you’re on the hunt for the head and shoulders pattern, you’re already on the path to mastering technical analysis! Dive into this article to unlock the secrets of this powerful pattern and elevate your trading game. By the time you reach the end, you’ll wield the H&S pattern like a pro. Armed with clear visuals and expert insights. Get ready to conquer the markets, future trader!
What is head and shoulders pattern?
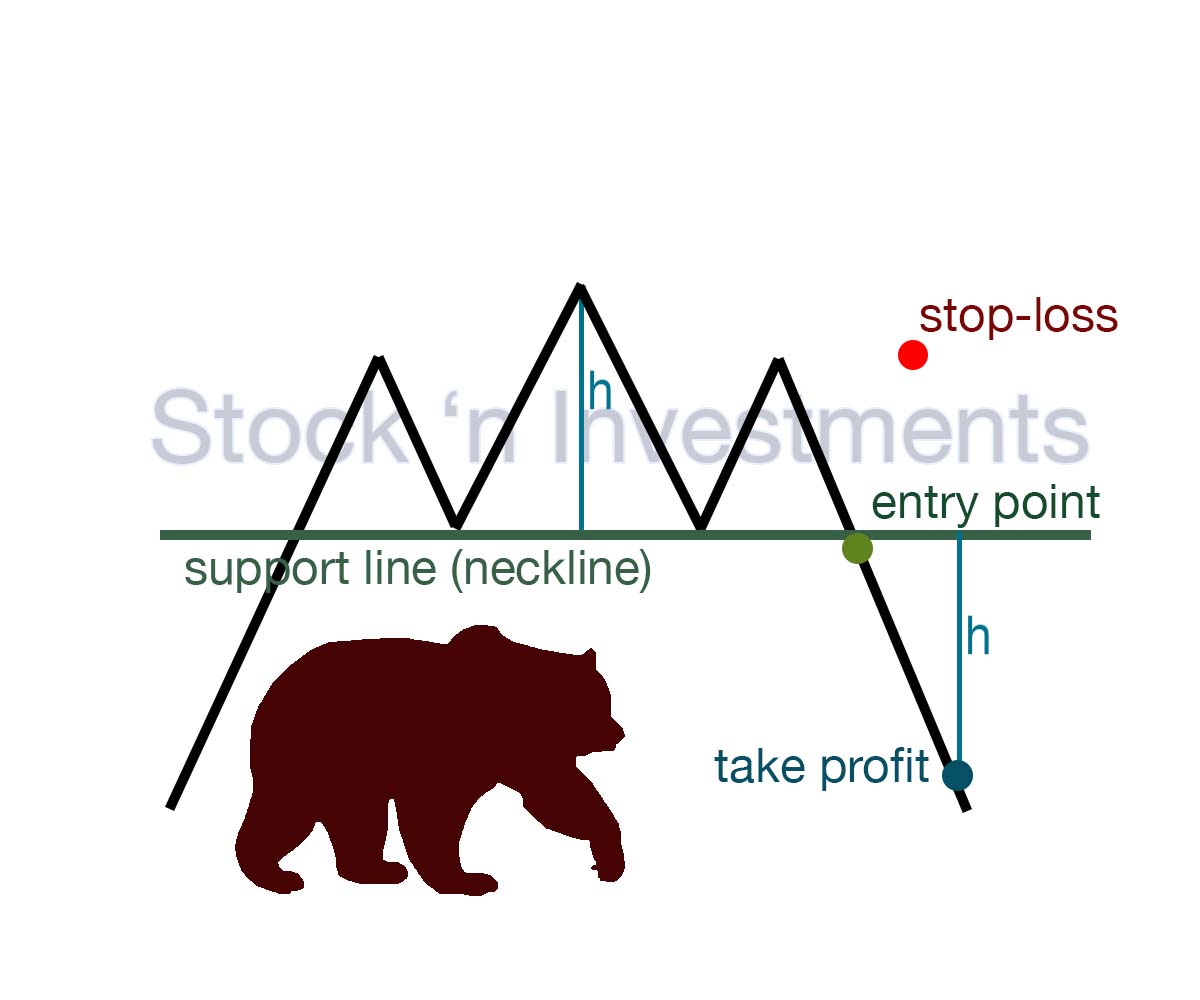
The h&s chart pattern is a key component of stock market analysis. Serving as a reliable indicator of potential trend reversals. Comprising three distinctive peaks — the central head flanked by two shoulders — it forms along a support line known as the neckline. Typically, after the completion of head and shoulders pattern, a downward price movement breaks the neckline. Signaling a shift from a bullish to a bearish trend. Traders often interpret this breakout as an opportunity to enter short positions. Moreover, the pattern offers valuable insights into risk management. With traders commonly placing stop-loss orders above the peak of the head to limit potential losses in case of unexpected price rises.
Inverted head and shoulders pattern
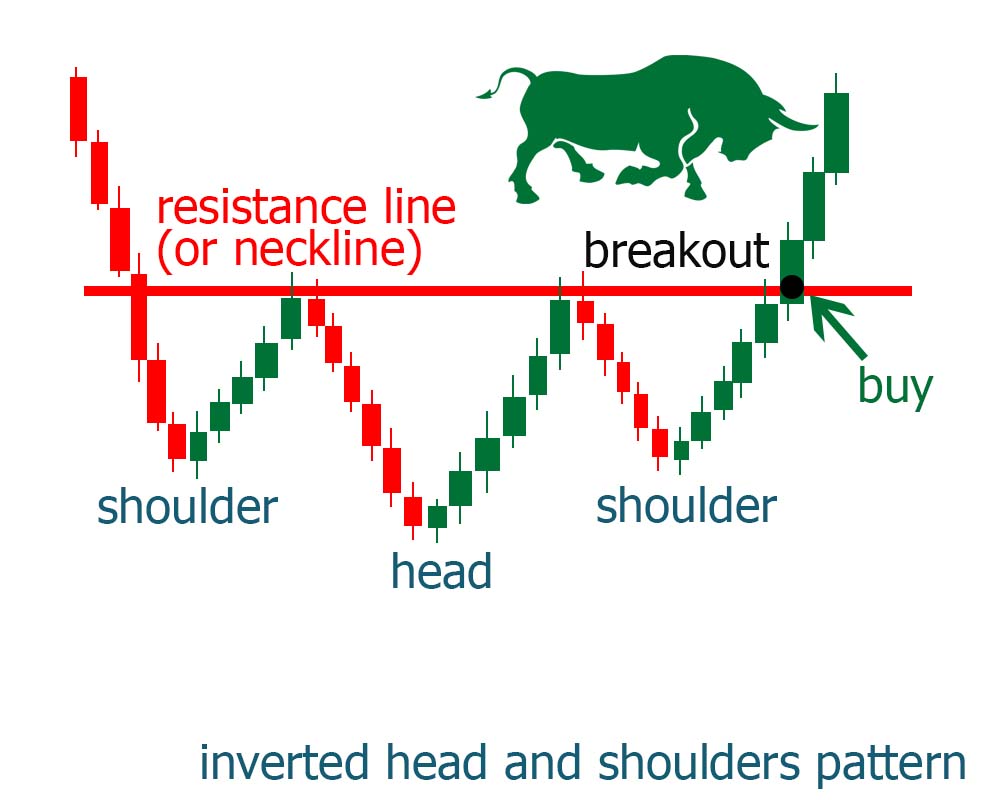
The inverted h&s pattern is a bullish reversal pattern commonly found in financial markets. It is essentially the inverse of the traditional h&s pattern. Instead of three peaks with the central one being the highest (head) and the flanking ones (shoulders) being lower, the inverted head and shoulders formation features three troughs, with the central one being the deepest (head) and the outer ones (shoulders) being shallower. This pattern typically forms after a prolonged downtrend. And indicates a potential reversal to an uptrend when the price breaks above the neckline. Traders often interpret this breakout as a signal to enter long positions.
Head and shoulders pattern rules
- Interpreting a chart with a head and shoulders structure involves identifying peaks resembling shoulders with a central higher peak. Indicating a potential trend reversal.
- The neckline is a support level connecting the lows of the two shoulders. It’s a crucial component of the pattern and serves as a confirmation level for the pattern’s validity.
- Volume should ideally decrease as the pattern develops, indicating weakening bullish momentum.
- The pattern is confirmed when the price breaks below the neckline. This breakout signals a potential trend reversal from bullish to bearish in head and shoulders pattern.
- The target price for the pattern is estimated by measuring the distance from the head to the neckline and projecting it downwards from the breakout point.
- Traders typically wait for a retest of the neckline after the breakout to confirm the validity of the pattern. Before entering short positions.
H&S pattern breakout
A head and shoulders pattern breakout refers to the moment when the price of a security breaks below the neckline of the h&s formation. This breakout is significant because it often signals a potential trend reversal from bullish to bearish. Traders who recognize this breakout may interpret it as a signal to sell or short the security, anticipating further downward movement in price. The breakout is typically accompanied by increased trading volume, providing confirmation of the pattern’s validity.
Advantages of the head and shoulders formation
- It provides a clear and visually identifiable signal of a potential trend reversal, making it easy for traders to recognize and act upon.
- The pattern is regularly confirmed by a breakout below the neckline, which adds validity to the reversal signal and helps traders make more informed decisions.
- Traders can implement effective risk management strategies by placing stop-loss orders above the pattern’s right shoulder. Limiting potential losses if the reversal signal proves to be false.
- Successfully trading the head and shoulders pattern can lead to significant profits. Prices reverse and begin a new trend in the opposite direction.
- The pattern can be applied across various time frames and financial markets, providing traders with opportunities in different trading environments.
Disadvantages of the head and shoulders formation
- Like any technical pattern, the h&s structure can produce false signals. This leading to losses for traders who rely solely on its appearance for decision-making.
- Identifying the pattern requires subjective interpretation of price action. Which can lead to differing opinions among traders and potential ambiguity in pattern recognition.
- Waiting for confirmation of the pattern, such as a neckline breakout, can be time-consuming. Potentially causing traders to miss out on other trading opportunities while they wait for confirmation.
- Random price fluctuations and market noise can obscure the Head and Shoulders formation. Making it difficult to distinguish from regular price volatility or other chart formations.
- In strongly trending markets, the pattern’s effectiveness may diminish. Prices continue to move in the direction of the trend, despite the formation of a head and shoulders pattern.
Placing the neckline
The neckline serves as a critical level of support or resistance in the H&S pattern, guiding traders in strategic decision-making. To establish the neckline, first identify the left shoulder, head, and right shoulder on the chart. In the standard head and shoulders setup (at market tops), connect the low after the left shoulder with the low formed after the head to form the neckline. Conversely, in the inverse head and shoulders pattern, connect the high after the left shoulder with the high created after the head to delineate the neckline. Understanding the significance of the neckline is essential for traders to interpret potential breakout or reversal signals accurately.
The challenges of trading head and shoulders
- Head and shoulders patterns can sometimes produce false signals. Leading to losses if traders act solely on pattern recognition without confirmation from other indicators or market context.
- Interpreting the pattern requires subjective analysis. Which can lead to differing opinions among traders and potential ambiguity in pattern recognition, making it challenging to make confident trading decisions.
- Waiting for confirmation, such as a neckline breakout, can be time-consuming. And may cause traders to miss out on other trading opportunities while they wait for confirmation, impacting overall profitability.
- Random price fluctuations and market noise can obscure the head and shoulders pattern. Making it difficult to distinguish from regular price volatility or other chart formations, leading to misinterpretation and false signals.
- In markets that exhibit a strong trend, the head and shoulders formation may not result in a reversal, but rather a continuation of the existing trend. Causing traders to enter trades in the wrong direction and incur losses.
Understanding what head and shoulder means in technical analysis
A head and shoulders pattern is a significant technical analysis formation that typically indicates a trend reversal in a financial market. It consists of three successive peaks: the central peak (the head) is the highest, flanked by two lower peaks (the shoulders) on either side. These peaks are connected by a trend line, known as the neckline. The pattern signifies a transition from a bullish trend to a bearish one, with the price expected to decline after breaking below the neckline. Traders often interpret this pattern as a sell signal, anticipating further downward movement in the asset’s price.
A failed head and shoulders formation
A failed head and shoulders formation occurs when the anticipated trend reversal signaled by the pattern does not materialize as expected. Despite the formation of the characteristic head and shoulders structure, the price fails to break below the neckline, or if it does, it quickly reverses back above it. This failure to confirm the pattern’s bearish signal suggests a lack of selling pressure and may lead to a continuation of the prior uptrend rather than a reversal to a downtrend. Traders who anticipated a reversal based on the head and shoulders formation may experience losses if they entered short positions prematurely.
Pingback: Stock Market Patterns: Your Roadmap to Trading Success Bulls & Bears
Pingback: Essential Techniques for Trading Analysis - Stock 'n Investments
Pingback: Stock Market Patterns, 12 options Stock 'n Investments