At first glance, trading seems simple. You just need to know two points: the entry point into a position and the exit point from it. The problem is that no one knows exactly where these points are. However, there are certain patterns, called stock market patterns or technical analysis figures, that can help. Let’s find these points using the example of the descending wedge pattern.
Key elements of the descending wedge pattern
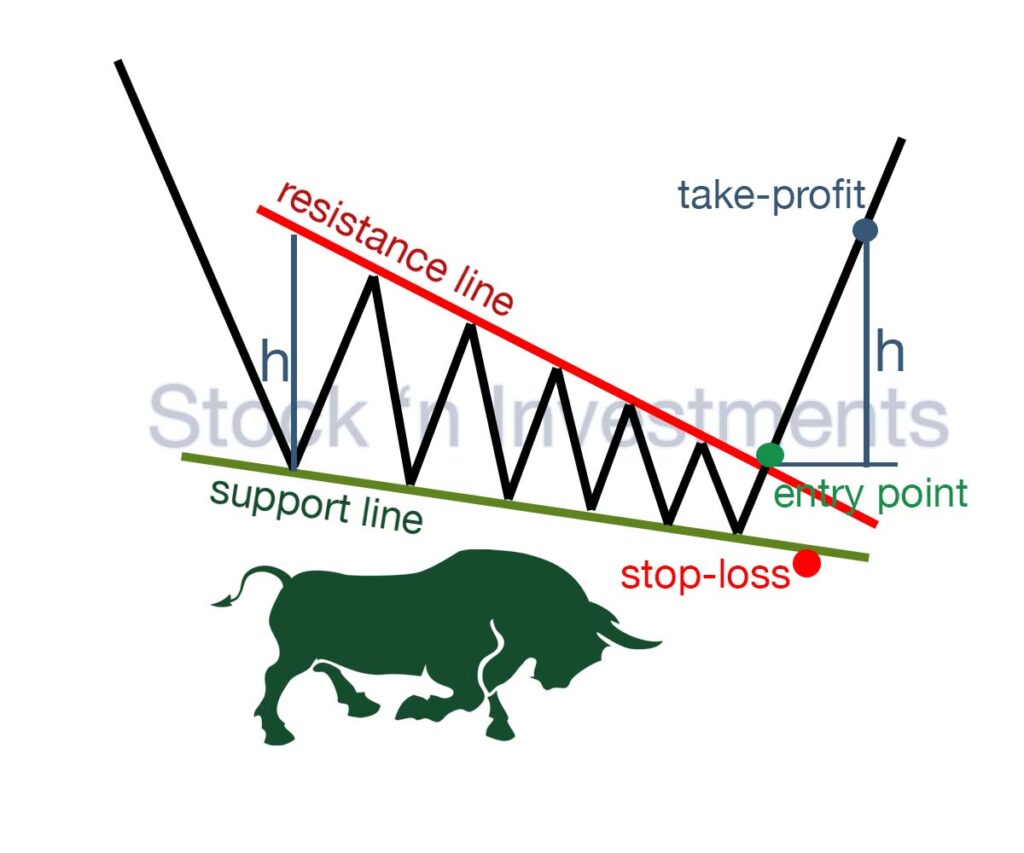
Converging trend lines
- upper line (resistance line)
- lower line (support line)
The lines converge, creating a wedge shape.
Declining prices
The pattern forms during a period of declining prices, although prices may fluctuate slightly within the wedge.
Decreasing trading volumes
Typically, trading volumes decrease as the wedge forms, indicating a weakening bearish momentum.
Breakout of the upper trend line
A key signal for the completion of the descending wedge pattern is the breakout of the upper trend line, often accompanied by increased trading volumes.
The breakout indicates a potential bullish reversal.
Target price
Determined by measuring the height of the wedge (the distance between the highest and lowest points) and projecting this distance from the breakout point.
What is the entry point in a position and the exit point from it?
The entry point in a position is the moment of purchasing an asset, as well as the opening of a short or long position. The exit point from a position is the moment of selling the asset or closing the positions.
Entry point in descending wedge pattern
Identify the Pattern. Determine when the price is forming a descending wedge, characterized by two converging trend lines: one connecting descending highs and the other connecting descending lows.
Wait for the Breakout. Watch for the price to approach and break above the upper trend line of the wedge. This breakout is a key signal for entering the position.
Confirm the Breakout. Ensure the breakout is accompanied by increasing trading volumes. This confirms the breakout is valid.
Enter the Position. Enter the position after the candlestick closes above the upper trend line. This reduces the risk of a false breakout.
Exit point in descending wedge pattern
Determine the Target Price. Measure the height of the wedge from the highest to the lowest point. Project this distance from the breakout point to set the target price.
Resistance Levels. Pay attention to key resistance levels that may affect price movement. These can include previous peaks or important psychological levels.
Technical Indicators. Use technical indicators like RSI or MACD to get additional signals on potential reversals or overbought conditions.
Exit the Position. Exit the position at the target price or when there are signs of trend reversal confirmed by technical indicators.
Additional Approaches
Stop-Loss. Set a stop-loss below the last local low within the wedge to minimize losses in case of an unexpected downward price movement.
Gradual Exit. Some traders exit the position gradually, in parts, to lock in profits as the target levels are reached.
How do emotions and psychological factors influence decisions about entering a position in the descending wedge pattern?
Fear of missing out (FOMO). Traders may rush into a position due to the fear of missing out, especially if they see the price starting to turn. This can lead to premature entry without waiting for confirmation of the breakout.
Uncertainty and doubts. Uncertainty about their analysis can cause traders to hesitate in entering a position. They might wait too long and miss the optimal entry point, which can reduce potential profits.
How do emotions and psychological factors influence decisions about exiting a position in the descending wedge pattern?
Greed. Traders might delay exiting a position, hoping for even higher profits, even when the price reaches their target level. This can lead to losing already accumulated profits if the market turns against them.
Fear. Fear of losing earned money can cause traders to exit a position too early, not allowing the market to fully realize the potential of the breakout pattern. This can reduce overall trading profits.
Panic. Sudden price fluctuations can cause panic, forcing traders to exit a position at the first sign of trouble, even if the overall trend remains favorable.
How do trading volumes affect your decision to enter a position in the descending wedge pattern?
Trading volume is an important aspect when analyzing the descending wedge formation and can influence the decision to enter a position.
Confirmation by breakout. Increasing trading volumes during the breakout of the upper (resistance) line of the descending wedge can confirm the strength of the movement and support its reliability. High volumes along with the breakout can serve as a signal to enter a position.
Reversal confirmation. Decreasing trading volumes during the formation of the descending wedge can indicate exhaustion of volumes and a potential trend reversal. Increasing volumes during the breakout of the upper line can confirm this reversal and serve as a signal to enter a position.
Confirmation of pattern reliability. Large trading volumes during the breakout can reinforce the strength of the movement and indicate a high probability of further trend development. Such volumes can confirm the reliability of the descending wedge pattern and provide more confidence to enter a position.
Warning of a potential trap. Low trading volumes during the breakout or a significant expansion of the wedge can indicate a potential trap for traders. Relatively low volumes during the breakout can indicate weakness in the movement and increase the risk of entering a position.
Confirmation of trading signals. Trading volumes can confirm other trading signals, such as signals from other technical indicators. For example, large volumes along with a signal from an indicator can reinforce the strength of the movement and confirm the signal to enter a position.
How to determine the target price based on the height of the descending wedge pattern?
To determine the target price based on the height of the descending wedge formation, you can use the target projection method.
Measure the pattern height. Start by measuring the distance from the highest point of the upper line to the lowest point of the lower line of the pattern. This will give you the pattern height.
Use percentages or Fibonacci levels. Many traders use various percentages or Fibonacci levels to determine target zones. Typically used levels include 100%, 127.2%, 161.8%, etc., which reflect potential target move zones.
Project target levels. After measuring the descending wedge pattern height and choosing the percentages or Fibonacci levels, use these values to project target levels. Add or subtract these values from the breakout price of the upper line (or according to your entry into the position) to determine potential target levels.
Consider other factors. Also, consider other factors that may affect the price, such as previous support or resistance levels, additional technical indicators, fundamental factors, etc.
Monitor target levels. Watch for price reactions around these levels. If the target level is reached and the price starts to reverse, this may signal an exit from the position.
How can news and fundamental factors influence decisions about entering and exiting a position in the descending wedge pattern?
Positive news. Positive news or fundamental factors indicating an improvement in the underlying asset’s fundamentals can support the entry signal. For example, an increase in a company’s profitability or the announcement of a new product launch can strengthen the position and support an upward movement.
Negative news. Negative news or fundamental factors, such as a deterioration in a company’s financial condition or industry outlook, can cause a downward trend reversal. This can signal an exit from the position or even the opening of a short position.
Central banks and macroeconomic events. Decisions by central banks regarding interest rates, and macroeconomic indicators (such as GDP, unemployment, inflation, etc.) can have a significant impact on the market. Positive signals, such as an increase in interest rates, can support upward movement, while negative signals can lead to a market reaction downward.
Geopolitical events. International events such as political conflicts, trade wars, or crises can also impact the market. For example, escalating geopolitical tensions can increase risk and lower investor sentiment, which can affect asset prices.
Fundamental analysis. Evaluating a company’s fundamental indicators, such as financial reports, current market conditions, competitive advantage, etc., can also influence decisions about entering and exiting a position. If fundamental data show improvement in the outlook, this can be a signal to enter a position.
Conclusion
Successful trading of the descending wedge pattern requires a deep understanding not only of the pattern itself but also of how to correctly identify entry and exit points. Determining the optimal entry point involves studying the formation of the pattern, confirming signals from other technical indicators, as well as considering fundamental factors and market trends.
For exit points, it is important to have a strategy for managing risks and profits. This includes setting stop-loss levels to protect against losses and establishing target profit levels for closing the position.
In addition to technical aspects, managing trader emotions and psychology is crucial. Planning and discipline in making decisions regarding entry and exit points can help avoid emotional losses and maintain a rational approach to trading.
Overall, thorough research and analysis of entry and exit points are key elements of successful trading with the descending wedge pattern and can contribute to achieving stable results in financial markets.