The symmetrical triangle pattern is a continuation pattern often observed in stock market patterns. It is characterized by two converging trend lines connecting a series of sequential peaks and troughs. These trend lines form a triangle that points towards the right, suggesting a period of consolidation before the price breaks out in the direction of the existing trend.
Key features of the symmetrical triangle pattern
Trend lines
- The upper trend line is formed by connecting a series of lower highs.
- The lower trend line is formed by connecting a series of higher lows.
- These lines converge to create the triangle, indicating decreasing volatility.
Volume
Decreasing volume during formation. At the beginning of the formation of a symmetrical triangle pattern, trading volume gradually decreases. This reflects decreasing volatility and market uncertainty as prices oscillate between the converging trend lines.
Low volume during consolidation. Throughout most of the formation of the triangle, trading volume remains below average. This indicates a lack of conviction among market participants who are waiting for a decisive move.
Increasing volume at breakout. When the price breaks out of the triangle, trading volume usually increases significantly. This confirms the strength of the breakout and indicates that market participants are ready to support the new trend.
Duration of symmetrical triangle chart pattern
- The pattern can form over various timeframes, from a few weeks to several months.
- The longer the duration of the pattern, the more significant the breakout is likely to be.
Breakout direction
- The breakout direction can be either upward or downward.
- Typically, the breakout follows the direction of the existing trend before the pattern’s formation.
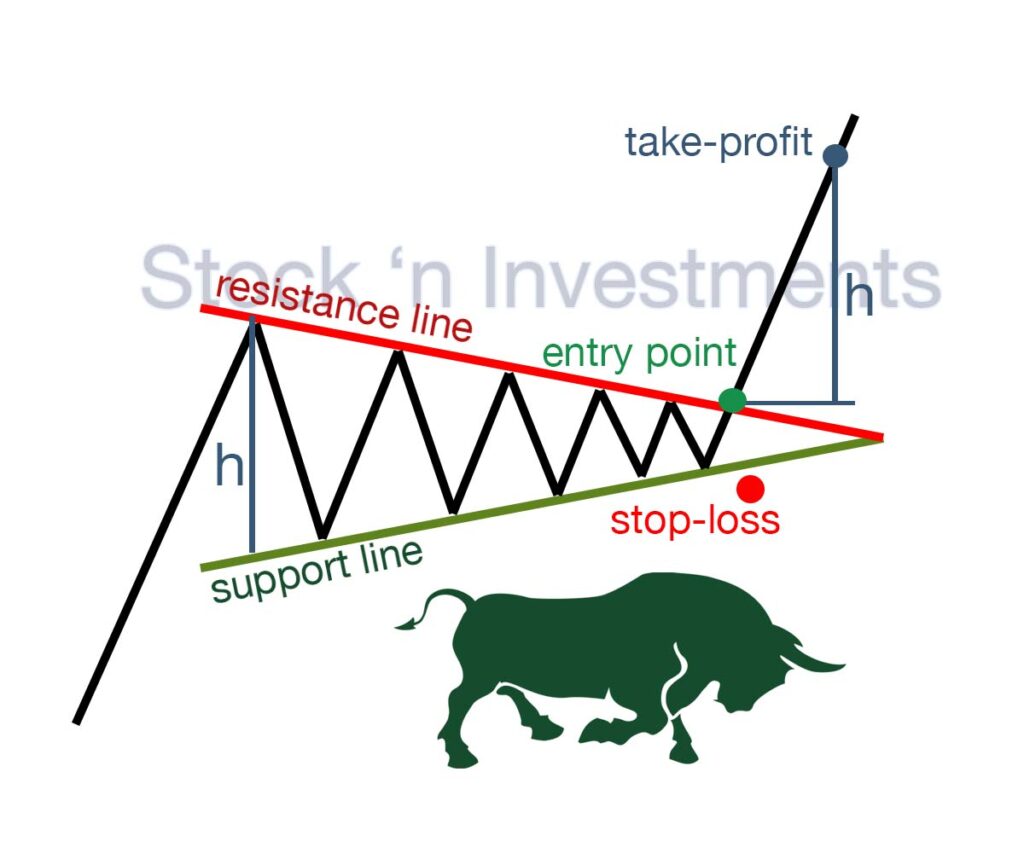
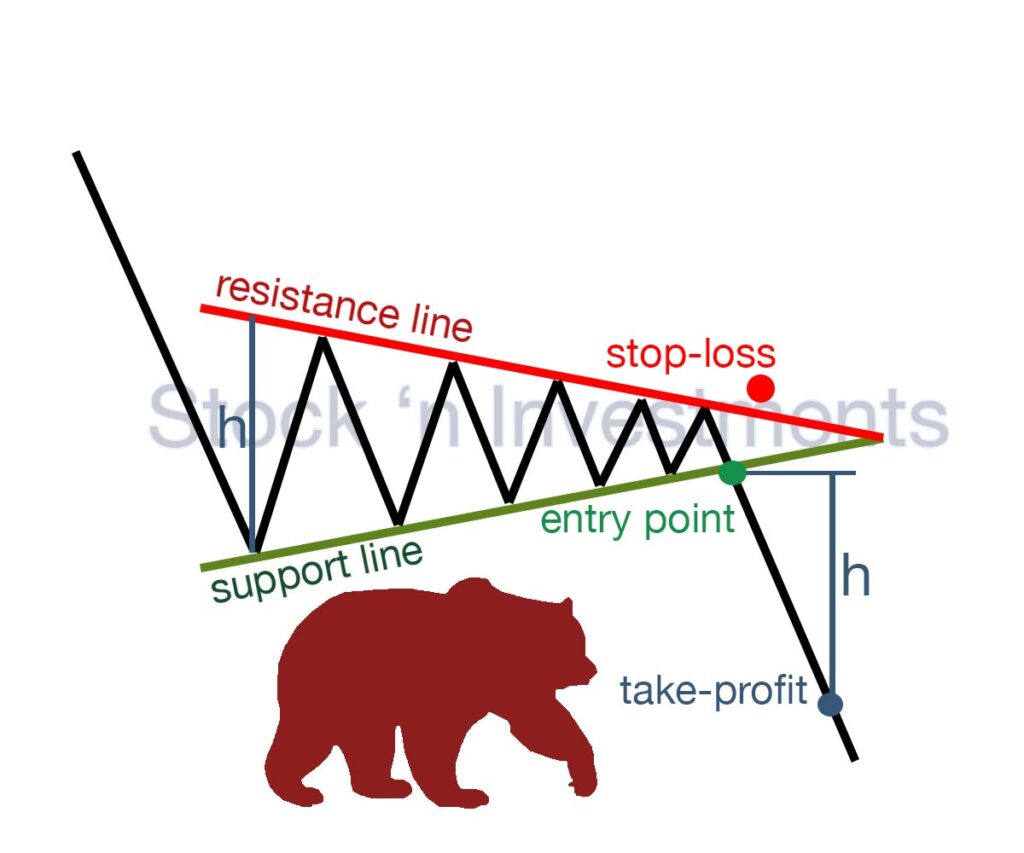
Target price
The target price after the breakout can be estimated by measuring the height of the triangle (the vertical distance between the initial high and low) and projecting this distance from the breakout point.
Trading strategies of symmetrical triangle pattern
Identifying the pattern. Look for converging trend lines that form a symmetrical triangle. Ensure the pattern is well-defined with at least two contact points on each trend line.
Confirming the breakout. Wait for a breakout above the upper trend line for a bullish signal or below the lower trend line for a bearish signal. Confirm the breakout with increased volume to avoid false signals.
Entering the trade. For a bullish breakout, enter a long position above the upper trend line. For a bearish breakout, enter a short position below the lower trend line.
Setting stop-loss orders. Place stop-loss orders just outside the opposite side of the triangle to manage risk. For a long position, place the stop-loss below the lower trend line. For a short position, place the stop-loss above the upper trend line.
Setting profit targets. Calculate the profit target by measuring the height of the triangle and projecting this distance from the breakout point.
How to determine if there will be a bullish breakout or a bearish breakout in a symmetrical triangle pattern?
Since the triangle pattern belongs to the trend continuation figures in technical analysis, the symmetric triangle should also be considered a continuation pattern. Therefore, if an asset’s price is rising before the pattern formation, a bullish breakout is expected. If the price is falling, a bearish breakout is anticipated.
Analysis of Trading Volume in a Symmetric Triangle Pattern
Trading volume is an important indicator when analyzing a symmetrical triangle chart pattern because it helps confirm the strength of the breakout. If the breakout is accompanied by a significant increase in trading volume, it indicates the reliability of the signal. If trading volume remains low, it may indicate weakness in the move and a potential false breakout.
Confirming the breakout. Before opening a position, ensure that the breakout is accompanied by an increase in trading volume. This increases the likelihood of a successful trade.
False signal warning. If trading volume does not increase during the breakout, it may signal a false breakout. In this case, it is better to avoid opening a position or use more conservative risk management strategies.
How to determine the entry point in a symmetrical triangle pattern?
Determining the entry point in a symmetrical triangle formation requires careful analysis and consideration of several factors.
Identify the pattern. First, identify the symmetrical triangle chart pattern on the price chart. This involves spotting two converging trend lines connecting a series of successive highs and lows.
Wait for the breakout. Monitor the prices to identify the moment when they break through one of the trend lines. This breakout can occur either upward or downward, depending on the market context and the preceding trend.
Confirm the signal. It’s crucial that the breakout is accompanied by an increase in trading volume. This helps confirm the strength of the signal and reduces the likelihood of a false breakout.
Establish the entry point. After the breakout is confirmed, consider opening a position in the direction of the breakout. This typically occurs after a candle closes outside the boundaries of the triangle.
Risk management. Set a stop-loss at a safe level to protect against losses in case the trade goes against you.
Determine the profit target. Consider setting a profit target based on the height of the triangle or other technical factors.
How to determine the exit point in a symmetrical triangle pattern?
Determining the exit point in a symmetrical triangle formation involves several considerations. Here are some steps to help identify the exit point:
Monitoring the breakout direction. Watch the direction of the breakout closely. If you entered a long position and the price breaks out above the upper trend line, it may signal continuation of the uptrend. Conversely, if you entered a short position and the price breaks out below the lower trend line, it may indicate continuation of the downtrend.
Assessing volume. Confirm the breakout with an increase in trading volume. Higher volume can validate the strength of the breakout and support your decision to stay in the trade.
Observing price action. Pay attention to price action following the breakout of the symmetrical triangle pattern. Look for signs of momentum and follow-through in the direction of the breakout. Strong, sustained price movement in the breakout direction can indicate a robust trend.
Using technical indicators. Consider using technical indicators such as moving averages, momentum oscillators, or trend-following indicators to confirm the direction of the trend and assess momentum. These indicators can provide additional confirmation for your exit decision.
Implementing trailing stops. To capture potential profits while allowing for continued upside potential, consider implementing trailing stops. Trailing stops adjust automatically as the price moves in your favor, helping to lock in gains while allowing for flexibility if the trend extends further.
Considering time frame. Take into account your trading time frame and goals. If you are trading on a shorter time frame, you may exit the position sooner to capture quick profits. On the other hand, if you are trading on a longer time frame, you may choose to ride the trend for a more significant move.
What are common strategies for setting stop-loss levels when trading symmetrical triangle patterns?
Setting stop-loss levels is crucial for managing risk when trading symmetrical triangle patterns.
Below/above the opposite trend line. Place your stop-loss order just below the lower trend line if you’re in a long position or just above the upper trend line if you’re in a short position. This level acts as a safeguard against potential false breakouts or reversals.
Outside the pattern. Set your stop-loss order slightly outside the symmetrical triangle pattern. This helps protect your position from market noise and increases the likelihood of avoiding premature exits due to minor price fluctuations.
Volatility-based stop-loss. Use measures of volatility, such as Average True Range (ATR), to determine the distance for your stop-loss order. Set the stop-loss level at a multiple of the ATR away from your entry point, considering the recent price volatility.
Support/resistance levels. Identify significant support or resistance levels outside the symmetrical triangle pattern and place your stop-loss order just beyond these levels. This approach adds an extra layer of protection against price reversals.
Percentage-based stop-loss. Determine a fixed percentage of your trading capital that you’re willing to risk on the trade. Calculate the distance between your entry point and the opposite trend line, then adjust your position size accordingly to ensure that if the stop-loss is hit, you only lose the predetermined percentage of your capital.
Trailing stop-loss. Implement a trailing stop-loss that automatically adjusts as the price moves in your favor. This allows you to lock in profits while giving the trade room to develop. You can trail the stop-loss below the swing lows (for long positions) or above the swing highs (for short positions) as the trend progresses.
What are some potential challenges or pitfalls when trading symmetrical triangle patterns?
False breakouts. Price may temporarily move beyond the trend lines but then reverse direction.
Low volume confirmation. Breakouts not accompanied by significant volume increases can be unreliable.
Misidentification. Incorrectly identifying the pattern can lead to poor trading decisions.
Market noise. Short-term price fluctuations within the pattern can mislead traders.
Time frame dependence. Patterns may behave differently across various time frames, complicating analysis.
What fundamental factors might influence the reliability of a symmetrical triangle pattern?
Earnings reports. Significant financial results can cause price movements that impact the pattern.
Economic indicators. Data such as GDP growth, employment rates, and inflation can affect market sentiment.
Industry news. Developments specific to the sector or company can alter price trends.
Interest rates. Changes in interest rates can impact investor behavior and market dynamics.
Geopolitical events. Political instability, trade negotiations, or conflicts can create volatility and disrupt patterns.
Conclusion
The symmetrical triangle pattern is a continuation pattern that forms when prices consolidate with converging trendlines, representing a state of equilibrium between buyers and sellers. It typically indicates that a breakout is imminent, which can occur in either direction. The breakout’s direction is often influenced by the preceding trend: a bullish breakout is more likely after an uptrend, and a bearish breakout is more likely after a downtrend. Key elements to watch include volume (which should increase during the breakout) and confirmation signals to avoid false breakouts. Fundamental factors such as earnings reports, economic indicators, and geopolitical events can also impact the pattern’s reliability.
Pingback: Triangle Patterns: Understanding & Analytics - Stock 'n Investments