The ascending wedge pattern, also known as a rising wedge pattern, is typically viewed as a bearish chart pattern in stock market patterns or technical analysis. It indicates a potential reversal or continuation of a downtrend. This pattern is formed by two converging trend lines that slope upwards, indicating a weakening uptrend.
Types of ascending wedge patterns
Reversal pattern
- Appears after an uptrend.
- Signal indicates a potential reversal to a downtrend.
- The ascending wedge pattern is confirmed when the price breaks below the lower trend line with increased volume.
Continuation pattern
- Appears during a downtrend.
- Suggests a continuation of the downtrend after a temporary upward movement.
- The pattern is confirmed when the price breaks below the lower trend line with increased volume.
Key characteristics of the ascending wedge pattern
Shape and formation
- Resistance line is sloping upwards, but at a slower rate compared to the lower trend line.
- Support line is also sloping upwards and converges with the upper trend line.
- The price moves between these two lines, forming higher highs and higher lows, but the range between the highs and lows narrows over time, creating a wedge shape.
Volume
Volume typically decreases during the formation of the wedge, indicating that the buying interest is waning. A breakout, especially with increased volume, often confirms the ascending wedge pattern.
Duration
The pattern can develop over various time frames, typically ranging from a few weeks to several months.
Trading the ascending wedge pattern
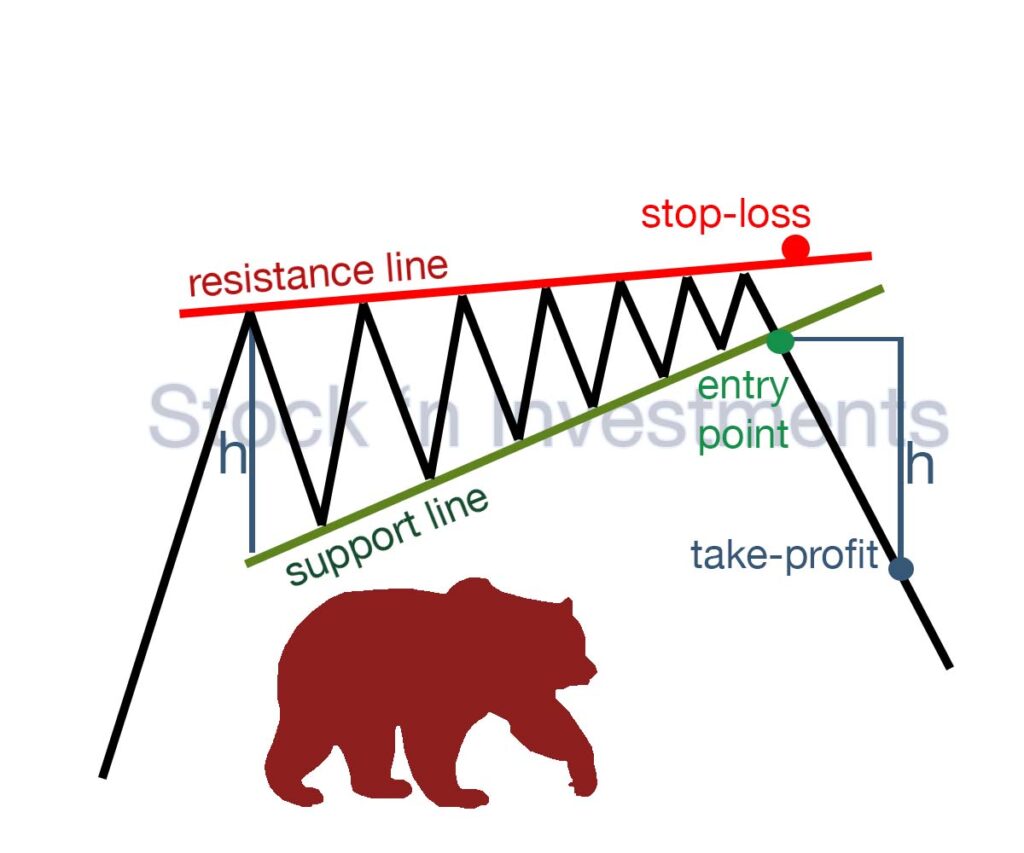
Entry Point. Enter a short position when the price breaks below the lower trend line with significant volume, confirming the pattern.
Stop-Loss. Place a stop-loss order above the most recent high within the wedge to manage risk in case the breakout fails.
Profit Target. Measure the height of the widest part of the wedge and project this distance downward from the breakout point to set a profit target.
How much can you earn from trading the ascending wedge pattern?
Imagine a stock in an uptrend forming an ascending wedge over several weeks. The price makes progressively higher highs and higher lows, converging towards a point. Volume decreases as the wedge forms, indicating weakening buying pressure. Eventually, the stock price breaks below the lower trend line with a surge in volume. A trader might enter a short position at this point, with a stop-loss order placed just above the most recent high within the wedge. If the height of the wedge is $1000, the trader might set a profit target $1000 below the breakout point.
How to determine the exit point from an ascending wedge pattern?
Determining the exit point from a position based on the ascending wedge formation can be a challenging task, as it requires careful market analysis and risk assessment.
Target exit level
Traders often use the height of the wedge to determine a target exit level. This involves measuring the distance from the highest point of the wedge to the lowest point and projecting this distance downwards from the breakout point of the lower trend line of the wedge. This can serve as a target exit level for closing the position.
Support level
If the target exit level seems subjective or you prefer a more conservative approach, you can use support levels. This especially applies to levels identified during the analysis of previous price movements and confirmed by historical data.
Technical indicators
Alongside known support levels, technical indicators such as Moving Averages, Relative Strength Index (RSI), or Stochastic Oscillator can be used to confirm exit signals from the position.
Psychological levels
Psychological levels such as round numbers or historical highs or lows can also serve as target exit levels on the ascending wedge pattern.
Gradual exit
Some traders employ a gradual exit method where they close the position in parts, gradually reducing the position size over time.
Stop-limit orders
Setting stop-limit orders can be a useful approach for automatically closing the position when the target exit level is reached.
How do trading volumes change during the formation of an ascending wedge pattern?
To investigate the change in trading volumes, it is essential to identify several stages and consider each one separately.
Decreasing Trading Volumes During Pattern Formation
At the initial stages of forming an ascending wedge, trading volumes usually decrease. This indicates that the strength of the bearish trend is weakening.
Each new low in the pattern is formed with decreasing trading volumes, indicating the exhaustion of selling pressure.
Decreasing Volumes During Convergence of Trend Lines:
As the two trend lines (upper and lower) converge, trading volumes continue to decrease. This suggests that the market is preparing for a potential breakout.
Low volumes in the final phase of the wedge formation often indicate the exhaustion of momentum.
Increasing Volumes During Breakout:
A key characteristic of a successful breakout is a sharp increase in trading volumes. This indicates that buyers are actively entering the market, confirming the completion of the pattern and the start of a new bullish trend.
If the breakout is accompanied by a significant increase in volumes, this is a strong signal that confirms the validity of the breakout.
How to assess the risk-reward ratio in the ascending wedge pattern?
Assessing the risk-reward ratio when trading the ascending wedge formation involves determining the height of the wedge to calculate the target price, setting the stop-loss level to minimize risk, and calculating the risk-reward ratio. Traders typically look for a risk-reward ratio of at least 2:1, indicating that the potential profit is twice the possible risk. For example, if the pattern has a height of 10, to achieve a 2:1 profit-to-risk ratio, the stop-loss level should be set at 5.