Stock technical indicators are mathematical calculations based on the price, volume, or open interest of a security or contract. They are used by traders to analyze and predict future price movements, as well as to confirm breakouts in stock market patterns.
Types of stock technical indicators
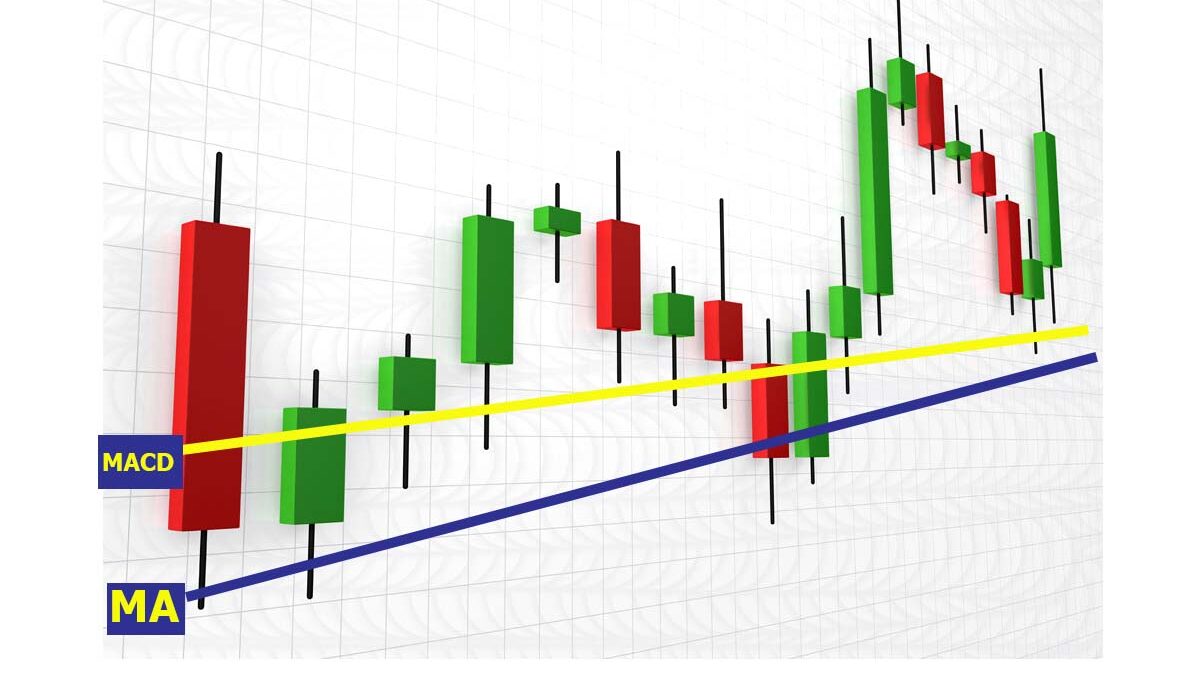
Moving Averages (MA)
Moving Averages are used to identify trends, confirm the direction of the market, and provide trading signals based on price crossovers. They help traders make more informed decisions by smoothing out price data and highlighting the overall trend.
Relative Strength Index (RSI)
The Relative Strength Index (RSI) is a tool used by traders to understand if a stock or other asset is overbought or oversold. Measures the speed and change of price movements on a scale of 0 to 100. An RSI above 70 indicates an overbought condition, while below 30 indicates an oversold condition.
Moving Average Convergence Divergence (MACD)
The Moving Average Convergence Divergence (MACD) is a popular tool of stock technical indicators, that helps traders identify changes in the strength, direction, momentum, and duration of a trend in a stock’s price. The MACD helps traders see when a stock’s trend might be changing, which can help them make more informed buy and sell decisions.
Bollinger Bands
Bollinger Bands help traders understand the volatility of an asset’s price and provide signals for potential buy or sell opportunities based on whether the price is overbought or oversold.
Stochastic Oscillator
Compares a particular closing price of a security to a range of its prices over a certain period. The oscillator ranges from 0 to 100, with readings above 80 indicating overbought conditions and below 20 indicating oversold conditions.
Average True Range (ATR)
The ATR is used to gauge the volatility of an asset, helping traders make decisions about stop-loss levels and identifying potential breakouts.
On-Balance Volume (OBV) as one of main of stock technical indicators
OBV is used to track the flow of volume in and out of an asset, helping traders confirm trends, identify potential reversals, and signal breakouts in stock market patterns.
Fibonacci Retracement
Fibonacci Retracement is a tool that helps traders identify key levels where the price of an asset might find support or resistance.
Ichimoku Cloud
Ichimoku Cloud is a versatile tool that provides traders with a comprehensive view of the market’s trend, momentum, and key support and resistance levels, helping them make more informed trading decisions.
Commodity Channel Index (CCI)
The CCI is used to identify overbought and oversold conditions, spot potential trend reversals, and confirm the strength of a trend, making it a valuable tool for traders looking to make informed decisions about buying and selling assets.
Volume Weighted Average Price (VWAP)
A trading benchmark of stock technical indicators, that gives the average price a security has traded at throughout the day, based on both volume and price.
Parabolic SAR (Stop and Reverse)
Provides potential reversal points in the price movement of a security. Also, it places dots below the price in an uptrend and above the price in a downtrend.
What are the best technical indicators for stocks?
- Moving Averages
- Relative Strength Index (RSI)
- Moving Average Convergence Divergence (MACD)
- Bollinger Bands
- Stochastic Oscillator
- Commodity Channel Index (CCI)
- Average Directional Index (ADX)
- Volume Indicators
This is the best technical indicators for analyzing stocks.
What are some practical tips for using stock technical indicators?
- Use a combination of indicators to confirm signals.
- Always consider the market context and other factors, such as fundamental analysis.
- Set stop-loss orders to limit risks.
- Test your strategies on historical data before using them in the real market.
Why are stock technical indicators important in forming stock market patterns?
Trend Identification. Technical indicators like moving averages and the Moving Average Convergence Divergence (MACD) help traders determine the direction of the trend. Knowing the trend direction allows traders to form patterns more effectively, such as ascending or descending triangles.
Breakout Confirmation. Indicators like Bollinger Bands and the Relative Strength Index (RSI) can confirm breakouts from patterns such as consolidation or channels. For example, if the price breaks above the upper Bollinger Band, it can indicate a strong upward move, confirming a breakout.
Volatility Measurement. Bollinger Bands and the Average True Range (ATR) are used to measure market volatility. High volatility can indicate a possible breakout from patterns like flags or wedges.
Overbought/Oversold Identification. RSI and the Stochastic Oscillator of stock technical indicators help determine if a stock is overbought or oversold. This can be useful in forming patterns, as overbought conditions might indicate a potential downward reversal, while oversold conditions might indicate an upward reversal.
Trend Strength Evaluation. The Average Directional Index (ADX) helps assess the strength of a trend. A strong trend confirms that the forming pattern is likely to continue in the same direction, while a weak trend might indicate a potential reversal or sideways movement.
Trading Volume. Volume indicators like On-Balance Volume (OBV) and the Accumulation/Distribution Line confirm trends and patterns. Increasing volume during a breakout from a pattern can indicate its validity and strength.
Which stock technical indicators are best to use when forming a triangle pattern?
- Moving Averages (MA)
- Relative Strength Index (RSI)
- Bollinger Bands
- Moving Average Convergence Divergence (MACD)
- Average Directional Index (ADX)
- Volume Indicators
- Stochastic Oscillator
Conclusion
Using a combination of different indicators allows for a more comprehensive understanding of market conditions and enhances the effectiveness of trading strategies. However, it is important to remember that no indicator is perfect, so it’s always essential to consider the market context and apply indicators in conjunction with other analysis methods, such as fundamental analysis.
Overall, stock technical indicators are an indispensable tool for successful trading, providing traders with the ability to better understand market dynamics and make more informed decisions.
Pingback: Head and Shoulders Chart Pattern: Entry and Exit Points - Stock 'n Investments