The cup and handle pattern is a classic bullish technical analysis pattern that signals the continuation of an upward trend. It is one of the stock market patterns. To trade successfully in the markets, it is essential to study this pattern.
Cup and handle breakout
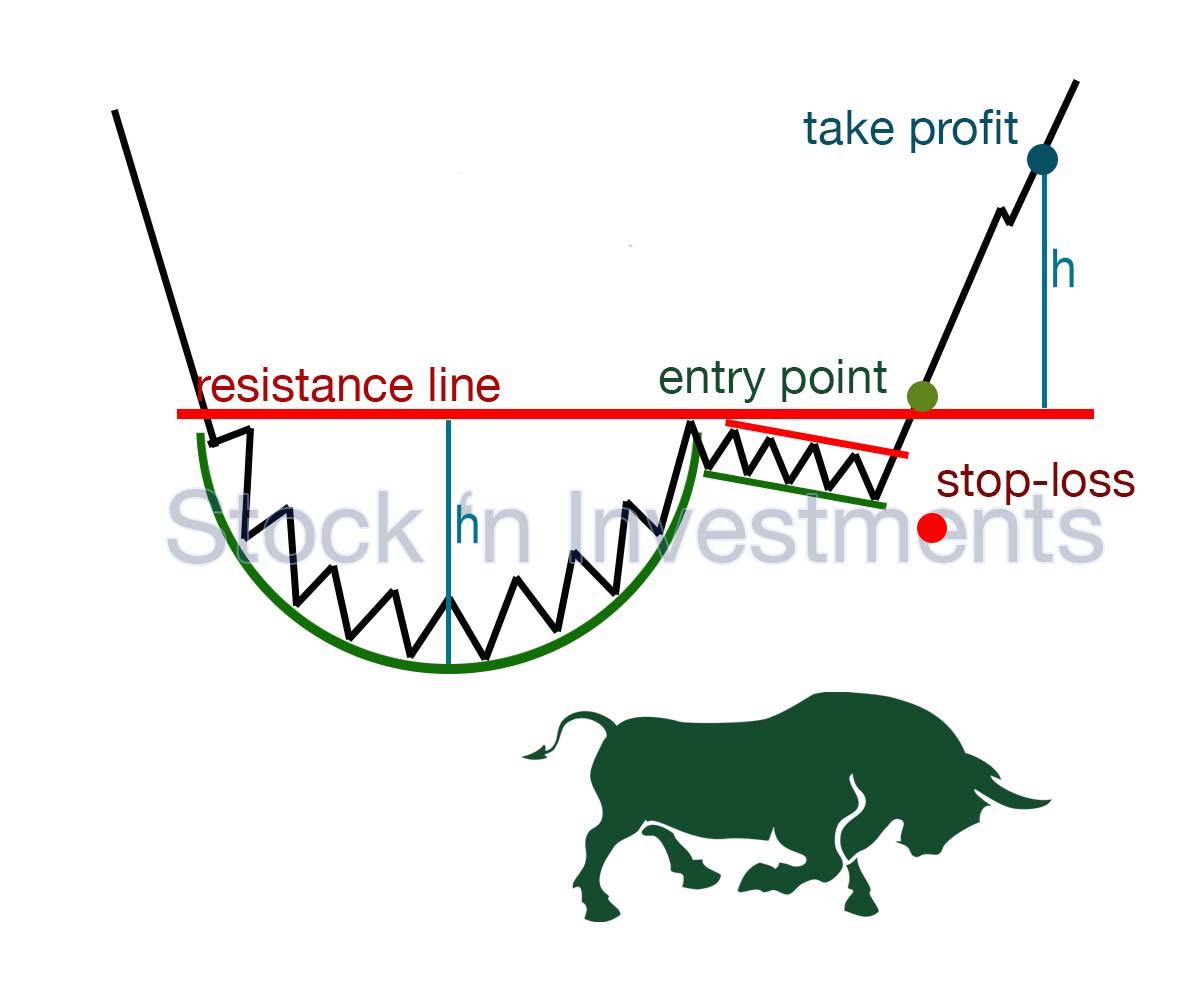
Identification. The pattern starts with a rounded bottom (the cup) followed by a consolidation phase (the handle).
Breakout Point. The breakout occurs when the price moves above the resistance level formed at the top of the cup. This is often confirmed with a closing price above this level.
Entry Strategy. Enter a long position when the price breaks above the resistance with increased volume.
Cup and handle stop-loss
Place a stop-loss order slightly below the lowest point of the handle. This protects against false breakouts and minimizes potential losses if the pattern fails. As the price moves in your favor, consider trailing the stop-loss to lock in profits.
Volume Considerations
During Cup Formation. Volume should be higher on the left side of the cup and lower during the formation of the handle, indicating a healthy consolidation.
On Breakout. A significant increase in volume during the breakout confirms the validity of the breakout. Higher volume indicates stronger buying pressure and increases the likelihood of a sustained upward move.
Technical indicators for the cup and handle pattern
Moving Averages. Use moving averages (e.g., 50-day SMA or EMA) to identify the overall trend and support the pattern’s bullish bias.
Relative Strength Index (RSI). Look for RSI above 50, indicating bullish momentum. Be cautious if RSI approaches overbought levels (above 70).
MACD (Moving Average Convergence Divergence). A bullish MACD crossover (when the MACD line crosses above the signal line) near the breakout point adds confirmation to the trade in the cup and handle.
Bollinger Bands. The price often contracts within the bands during the handle formation. A breakout above the upper band can provide additional confirmation of the breakout.
On-Balance Volume (OBV). Increasing OBV during the cup formation and at the breakout point supports the pattern’s strength.
How long does the Cup and Handle formation take to form on a chart?
The pattern can form on a chart over varying periods depending on market conditions and the timeframe.
Cup formation time
- medium-term cup (from 1 to 6 months)
- long-term cup (from 6 months to several years)
Handle formation time
- medium-term handle (from a few weeks to a few months)
- short-term handle (from a few days to a few weeks)
On daily or weekly charts, this pattern usually takes longer to form, while on hourly or minute charts, it can form much more quickly.
What is the best timeframe to use?
The best timeframe for the cup and handle pattern depends on your trading strategy and investment horizon. Daily and weekly charts are usually the most reliable for analyzing this pattern, as they provide more stable and trustworthy signals.
How to determine the entry point into a cup and handle formation position?
The entry point in the pattern is typically found at the breakout above the resistance level formed at the upper boundary of the cup.
Resistance level. This is the level at which the price encountered resistance multiple times during the formation of the cup. This level forms at the top of the cup before the handle begins to form.
Breakout. Entry into the position occurs when the price breaks above this resistance level. Ideally, the breakout is accompanied by an increase in trading volume, confirming the strength of the move.
Confirmation. Some traders wait for the candle to close above the resistance level to confirm the breakout before entering a position. This helps avoid false breakouts.
How to avoid a false breakout?
To avoid a false breakout in the cup and handle, traders often use several strategies:
Confirmation. Wait for confirmation before entering a trade. This could involve waiting for the price to close above or below the breakout level, depending on the direction of the breakout.
Volume Analysis. Look for increasing volume to confirm the breakout. A breakout accompanied by high trading volume is more likely to be genuine.
Use of Indicators. Utilize technical indicators such as the Relative Strength Index (RSI), Moving Averages, or Bollinger Bands to confirm the strength of the breakout.
Support and Resistance Levels. Consider the surrounding support and resistance levels in the cup and handle formation. Breakouts that occur above strong resistance or below significant support are more likely to be valid.
Patience. Exercise patience and wait for a clear signal. Rushing into a trade at the first sign of a breakout increases the risk of entering a false breakout.
Backtesting. Test your breakout trading strategy on historical data to see how effective it is at identifying genuine breakouts and avoiding false ones.
How often does a false breakout occur in the cup and handle formation?
The frequency of false breakouts can depend on the market, the specific pattern or figure, as well as the timeframe you are looking at. In certain market conditions, such as ranging markets or periods of low volatility, false breakouts may be more common.
Generally, false breakouts are quite common in financial markets, especially on shorter timeframes or in illiquid markets. Traders employ various methods of analysis, such as volume considerations, confirmation with indicators, pattern analysis, and support and resistance levels, to try to identify and avoid false signals.
To reduce the risk of false breakouts, it’s best to stick to a strategy and use additional confirmation tools to validate the signal before entering a position.
How to determine the exit point for the cup and handle pattern?
The exit point from a position in the pattern is typically determined by considering several factors:
Target profit level. This level is set based on the height of the cup. The distance from the bottom of the cup to the resistance level where the breakout occurred is projected upwards from the breakout point.
Stop-loss level. This is the level at which the trader is willing to close the position if the price moves in an unfavorable direction. It is usually set slightly below the lower boundary of the handle in the cup and handle formation.
Dynamic indicators. Traders can use moving averages or other technical indicators to determine when to exit the position.