If you’ve landed on this page and started reading, you’re probably eager to learn about technical analysis patterns. That’s a good start. Successful trading requires knowing different patterns and how to use them. Today, we’ll discuss the double bottom pattern. We’ll schematically depict all the details and explore how to utilize this pattern.
What is a double bottom pattern?
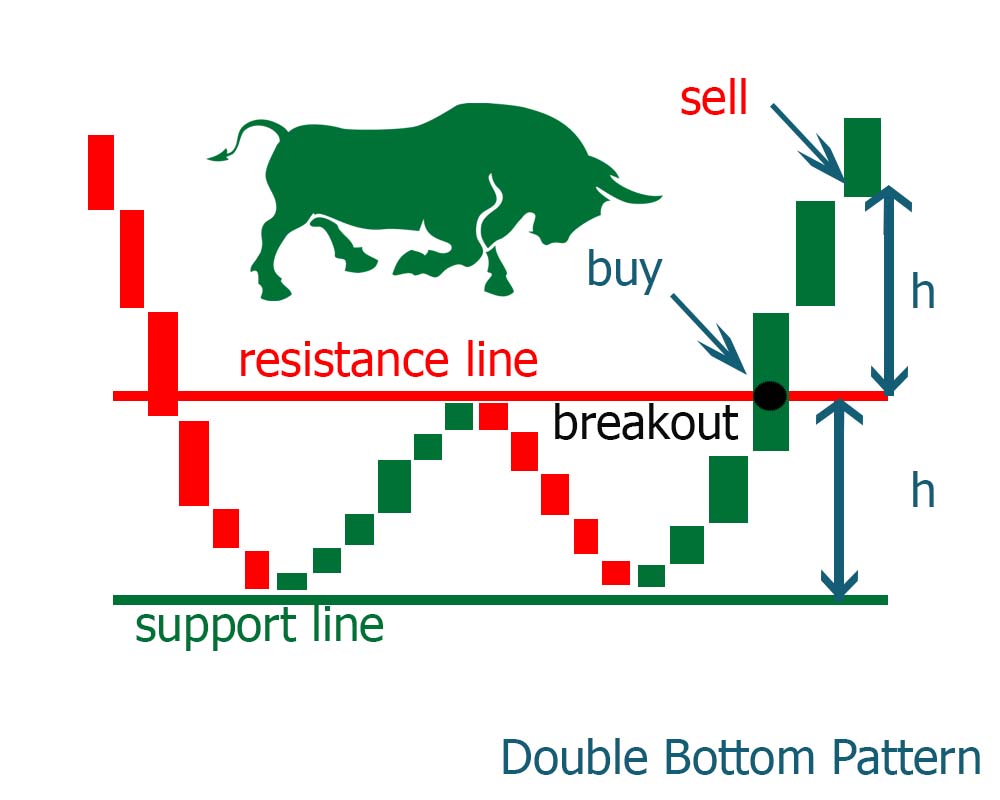
A double bottom in trading typically signifies a potential trend reversal from bearish to bullish. It mirrors the ‘double top’ but appears in the opposite direction. This pattern features two price lows at the same level, with a resistance line marking the chart’s upper boundary. Traders watch for a breakout above this resistance line as a signal to enter long positions, anticipating a trend reversal to the upside.
Characteristics of formation
Formation. The double bottom pattern consists of two distinct troughs (bottoms) that form approximately at the same price level, separated by a peak (intermediate high).
Price movement. The first bottom occurs as the price falls to a new low, then rises to form the peak. The price then declines again to form the second bottom, which is typically at the same level as the first bottom, indicating a strong support level.
Confirmation. The pattern is confirmed when the price breaks above the peak formed between the two bottoms. This breakout indicates that the downtrend is potentially over and an uptrend might begin.
Steps to Use the Double Bottom Pattern
Identify the pattern. Look for two consecutive lows that form at approximately the same level. These lows are separated by a peak (intermediate high). Between the two bottoms, the price should rise and form an intermediate high.
Analyze trading volumes. Pay attention to trading volumes. During the formation of the first bottom, volumes often increase, then decrease during the rise to the peak, and may increase again during the formation of the second bottom. Rising volumes during the breakout of the peak confirm the pattern’s strength.
Confirm the pattern. The double bottom pattern is confirmed when the price breaks above the level of the intermediate peak. This signals the potential start of an uptrend.
Enter the position. Enter a long position (buy the asset) when the price breaks and closes above the level of the intermediate peak. This is the entry point.
Set a stop-loss. To protect against potential losses, set a stop-loss slightly below the level of the second bottom. This ensures risk limitation in case the pattern fails.
Determine the target price. The target price is determined by measuring the distance from the bottom level to the peak level and adding this distance to the breakout level. For example, if the distance between the bottom ($500) and the peak ($600) is $100, the target price will be $700 ($600 + $100).
How does trading volume change in the double bottom pattern?
In a double bottom chart, trading volume typically changes according to the pattern formation and its confirmation.
First bottom. During the formation of the first bottom, trading volume usually increases as sellers resist further price declines.
Correction after the first bottom. After reaching the first bottom, trading volumes may decrease as the price temporarily moves away from the bottom.
Second bottom. During the formation of the second bottom, trading volumes may increase again or remain stable. This may indicate that sellers are losing momentum, and the low price level becomes attractive to buyers.
Breakout of resistance line. When the price breaks above the resistance line, trading volume typically increases, confirming the strength of the breakout and the reliability of the pattern.
When should you enter a position in the double bottom pattern?
Entering a position using the formation can be done after confirming the pattern and receiving a confirmation signal.
Breakout of the peak between the two bottoms. Enter the position when the price breaks above the level of the intermediate peak, which is between the two bottoms. This happens after the pattern is confirmed and strengthens its validity.
Confirmation by increasing trading volumes. Use trading volumes to confirm the strength of the double bottom pattern. A significant increase in volumes during the breakout of the peak can serve as an additional signal for entering the position.
Confirmation with other technical indicators. Some traders use other technical indicators like RSI, MACD, or the stochastic oscillator to confirm the entry signal. Strong confirmation from multiple indicators can make the entry into the position more reliable.
Price action analysis. During the breakout of the peak and entry into the position, also pay attention to price action and candlestick analysis. A strong bullish candlestick or price increase after the breakout can confirm the strength of the entry signal.
Consideration of fundamental factors. Although the pattern is primarily based on technical analysis, some traders also consider fundamental factors that may confirm the strength of the entry signal.
When should you exit a position in the double bottom pattern?
Reaching the target price. The target price is determined by measuring the distance from the bottom level to the intermediate peak level and adding this distance to the breakout level. Close the position when the price reaches the target level.
Using trailing stops. Use a trailing stop to automatically exit the position if the price reverses and starts to decline after reaching a certain level. This helps to lock in profits in case of a sudden trend reversal.
Signals from other technical indicators. Use other technical indicators like RSI, MACD, or the stochastic oscillator to identify signals of a potential trend reversal or weakening momentum. If these indicators signal a trend change, it may be a cue to exit the position.
Candlestick analysis. Pay attention to candlestick patterns that might indicate a trend reversal or price decline, such as the “shooting star” or “bearish engulfing” patterns. These patterns can serve as signals to exit the position.
Fundamental factors. If fundamental factors, such as company news or economic indicators, change and suggest a potential decline in the asset’s value, it may be a reason to exit the position.
What is the duration between the first and second bottoms?
The duration between the first and second bottom in the double bottom pattern can vary depending on the time frame you are analyzing this pattern on. However, generally, the duration of this period can be several weeks or months.
For a more accurate determination of the duration between bottoms, you can measure the number of candles (days or weeks) between the first and second bottom on the price chart. This will help you determine what duration between bottoms is typical for the particular asset and time frame.
Are there fundamental factors confirming a strong pattern?
Company financial metrics. Improvement in financial metrics such as earnings, revenue, and net income can confirm the strength of the pattern. If the company shows improved financial performance after the formation of the double bottom, it can be a positive signal for further stock price growth.
Industry fundamentals. If the industry in which the company operates demonstrates stable or improved fundamental health, it can support the strength of the double bottom pattern.
Macroeconomic factors. Changes in macroeconomic conditions such as GDP growth, unemployment reduction, or inflation stability can also confirm the strength of the pattern.
Political factors. Political events or decisions that may positively impact the company or industry can also confirm the strength of the double bottom pattern.
Technological or innovation changes. Adoption of new technologies or innovations can improve the company’s financial performance, which can support the strength of the pattern.
What stop-loss levels can be set to protect against losses in a double bottom pattern?
For setting stop-loss levels in a formation, several approaches can be considered:
Pattern lows. The stop-loss can be placed below the second low of the double bottom pattern. If the price breaks below this level, it may indicate a pattern failure and its reliability.
Trading volume. Stop-loss can be set considering trading volumes. For instance, if the price breaks below the second low with high trading volume, it could confirm the weakness of the pattern.
Technical support levels. Additional technical support levels, such as Fibonacci levels or previous price highs, can also serve as excellent levels to place stop-loss orders.
Risk-to-reward ratio. It’s important to consider the potential loss size and risk-to-reward ratio when setting stop-loss levels. Trailing stop techniques can also be used to protect profits and optimize profitable positions.
Summary
The double bottom pattern is a reliable bullish reversal pattern when correctly identified and confirmed. By analyzing volume and using proper entry and exit strategies, traders can effectively use this pattern to capitalize on the end of a downtrend and the beginning of an uptrend.
Pingback: Stock Market Patterns Bulls & Bears
Pingback: Essential Techniques for Trading Analysis - Stock 'n Investments
Pingback: Stock Market Patterns, 12 options Stock 'n Investments