If you’re exploring the wedge pattern, chances are you’re a budding trader, hungry for knowledge. You’re heading in the right direction. Understanding technical analysis patterns is pivotal for trading triumph. By the article’s end, you’ll grasp how to harness the wedge pattern effectively. Complete with illustrative diagrams and concise descriptions, consider this your guide. Here’s to your success, future trader!
What is a Wedge Pattern?
Indeed, the pattern is a significant technical formation characterized by converging trend lines on a price chart and one of the stock market patterns. These trend lines connect the highs and lows of a price series, illustrating the varying rates at which highs and lows are rising or falling. As these lines converge, they create a wedge shape, which traders closely monitor for potential price reversals or breakouts in the market. This pattern serves as a valuable tool for anticipating shifts in market sentiment and identifying potential trading opportunities.
Characteristic of the Pattern
- Converging trend lines. The pattern is marked by two trend lines that converge, either sloping upward (rising wedge) or downward (falling wedge).
- Declining volume. As the price progresses within the pattern, trading volume tends to diminish, indicating decreasing enthusiasm from market participants.
- Breakout. The pattern concludes with a breakout, where the price breaches one of the trend lines, signaling a potential reversal in the direction of the prevailing trend.
Types
- Descending (bullish, falling) wedge
- Ascending (bearish, rising) wedge
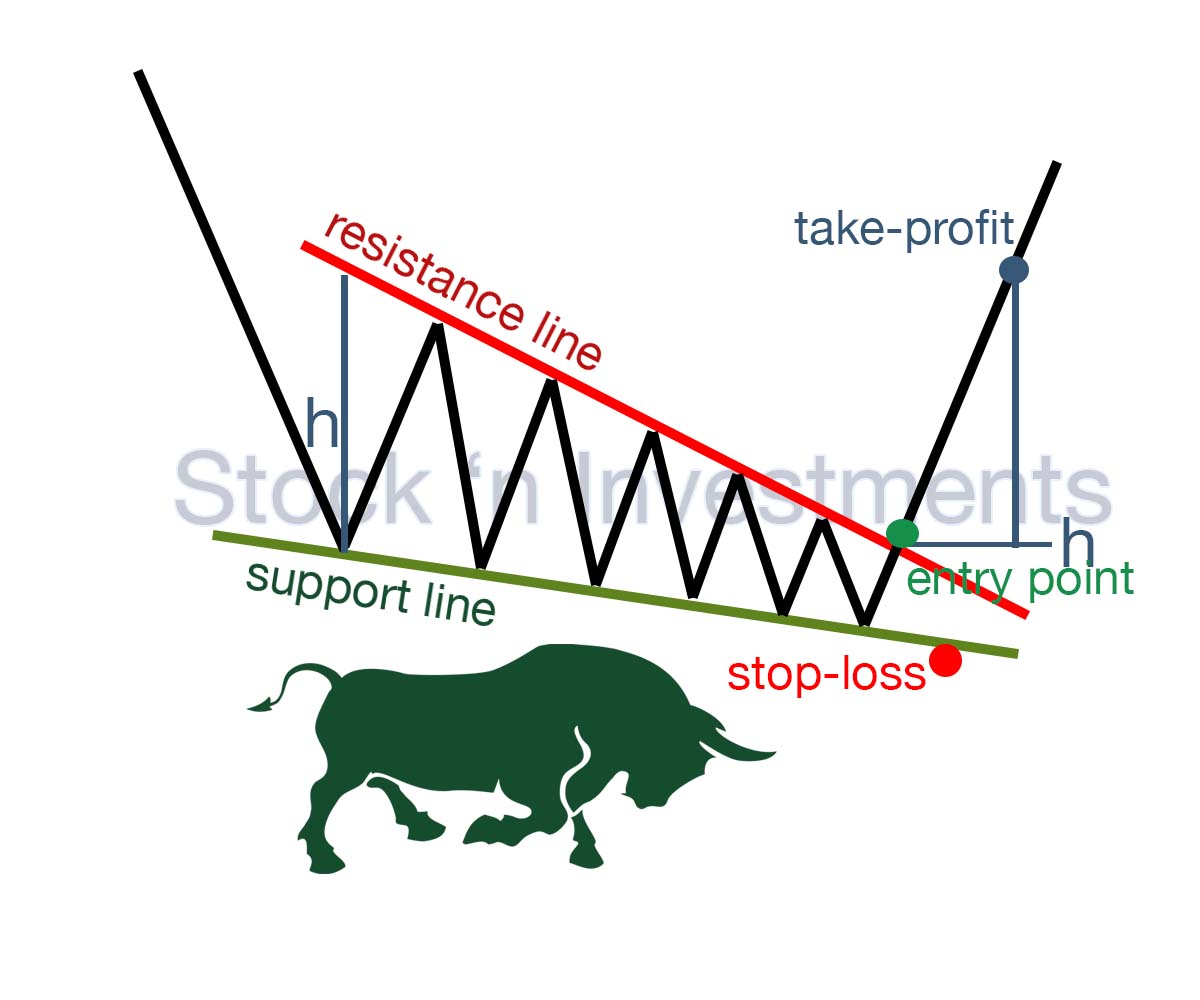
Descending wedge pattern
The pattern is a valuable tool in technical analysis, particularly for traders monitoring market price movements. Occurring within a downtrend, it signals potential entry or exit points. Despite forming in a downtrend, its bullish nature suggests a shift in market sentiment towards optimism. With angled downward support and resistance levels, it applies pressure on prices, yet the breakout usually occurs upward, signaling a potential trend reversal. This offers traders opportunities to enter long positions or exit short ones.
Volume characteristics
In a descending wedge pattern, look for decreasing volume during the formation phase and a significant increase in volume at the breakout. This volume behavior helps confirm the pattern’s validity and the strength of the resulting price movement.
Decreasing volume. During the formation of the descending wedge, the volume often decreases. This decline in volume indicates that the downward price movements are losing momentum, which can be a sign that a reversal may be coming.
Volume spike on breakout. When the price breaks out of the descending wedge pattern, there is typically a significant increase in volume. This volume spike confirms the breakout and suggests that the new trend (typically bullish) is gaining strength.
Breakout
When trading a descending wedge pattern, the breakout is a critical moment indicating a potential trend reversal. To effectively identify and confirm a breakout:
- Look for a close above the upper trendline to confirm the breakout.
- Verify the breakout with increased volume to ensure strong buying interest.
- Watch for bullish candlestick patterns and consistent follow-through price action.
- Consider a retest of the breakout level for additional confirmation.
Entry point
The optimal entry point for a descending wedge pattern is:
Upon breakout confirmation. When the price closes above the upper trendline of the wedge.
With volume confirmation. A significant increase in volume during the breakout confirms the entry.
On retest. If the price retests the breakout level (upper trendline) and shows bullish signals, it can offer a better entry point.
Stop-loss
Setting a stop-loss in a descending wedge pattern is essential for risk management. You can place it just below the lower trendline, use a percentage-based approach, or apply the ATR method to account for market volatility. Choosing the right stop-loss method depends on your risk tolerance and trading strategy.
Exit entry (take profit)
Setting a take profit level in a descending wedge pattern involves:
- Measuring the height of the wedge and projecting it from the breakout point.
- Using Fibonacci extension levels to identify potential price targets.
- Considering previous support and resistance levels to refine your take profit targets.
Is a descending wedge pattern a bullish pattern?
Indeed, the pattern is generally interpreted as a bullish signal. It suggests that despite the downward price movement losing momentum, buyers are gradually stepping in, potentially indicating a reversal of the downtrend.
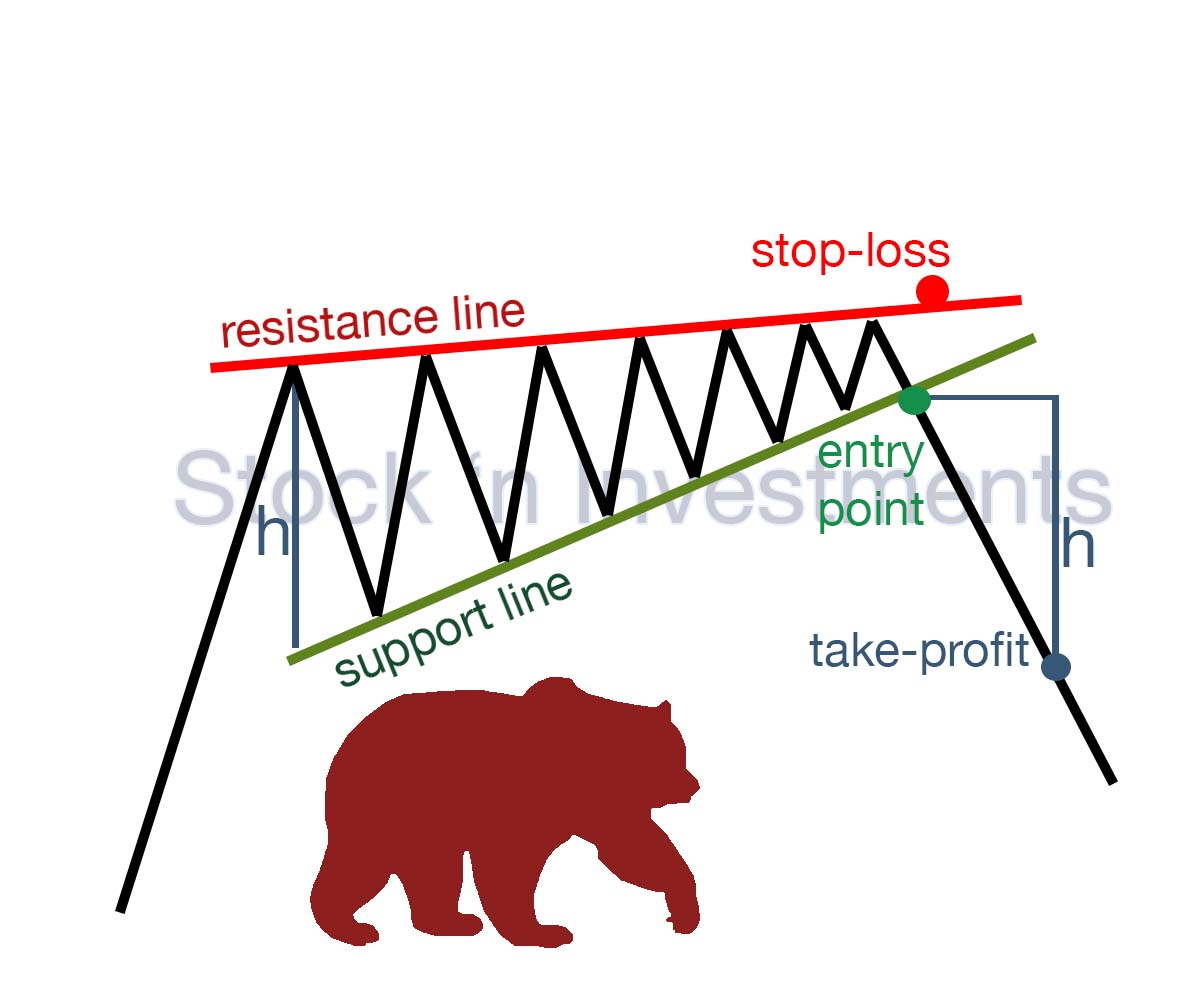
Ascending Wedge Pattern
The pattern is significant in technical analysis, offering insights to traders about future market movements. Forming within an uptrend, it suggests a possible reversal. Traders analyze this pattern to anticipate price reversals and manage their positions effectively. Its distinct shape, characterized by a narrowing price range and a stable upper line with a gradually rising lower line, indicates diminishing buying pressure and potential for reversal. Traders must distinguish this pattern from others and react promptly to its signals, considering factors like volume and confirmation from other indicators before opening short positions upon breaking the lower line.
Volume characteristics
In an ascending wedge, volume behavior helps traders identify and confirm the pattern:
- Decreasing volume during the formation phase signals weakening buying pressure.
- Low volume near the apex suggests a lack of conviction among market participants.
- Volume spike on the breakdown confirms the bearish breakout and strong selling interest.
Breakout
When trading an ascending wedge pattern, the breakout is a critical moment indicating a potential trend reversal. To effectively identify and confirm a breakout:
- Look for a close below the lower trendline to confirm the breakout.
- Verify the breakout with increased volume to ensure strong selling interest.
- Watch for bearish candlestick patterns and consistent follow-through price action.
- Consider a retest of the breakdown level for additional confirmation.
Entry point
The optimal entry point for an ascending wedge pattern is:
Upon breakdown confirmation. When the price closes below the lower trendline of the wedge.
With volume confirmation. A significant increase in volume during the breakdown confirms the entry.
On retest. If the price retests the breakdown level (lower trendline) and shows bearish signals, it can offer a better entry point.
Stop-loss
Setting a stop-loss in an ascending wedge pattern is essential for risk management. You can place it just above the upper trendline, use a percentage-based approach, or apply the ATR method to account for market volatility. Choosing the right stop-loss method depends on your risk tolerance and trading strategy.
Exit point (take profit)
Setting a take profit level in an ascending wedge pattern involves:
- Measuring the height of the wedge and projecting it from the breakdown point.
- Using Fibonacci extension levels to identify potential price targets.
- Considering previous support and resistance levels to refine your take profit targets.
Is a Ascending wedge pattern a bearish pattern?
Correct, the pattern is typically considered bearish. It often suggests that the price of a stock, which has been trending upwards, is nearing a point of potential reversal, with the likelihood of a downward breakout and a subsequent decline in price.
Wedge Pattern in Technical Analysis
Wedge patterns play a crucial role in technical analysis, as they provide valuable insights into potential trend reversals or continuations. Traders rely on these patterns to determine optimal entry and exit points for their trades. By recognizing wedge patterns, traders can anticipate shifts in market sentiment and make informed decisions about buying or selling assets.
It’s essential to use wedge patterns in conjunction with other technical indicators, such as the Moving Average Convergence Divergence (MACD) and volume, to confirm the strength of the breakout. Analyzing trading volume levels can help validate a potential price reversal indicated by a wedge pattern. For instance, a decrease in trading volume during the formation of a rising wedge suggests weakening momentum and an impending reversal.
Additionally, traders utilize oscillators like the Relative Strength Index (RSI) to further confirm potential price reversals signaled by wedge patterns. Overbought conditions in conjunction with a rising wedge formation or oversold conditions paired with a falling wedge formation strengthen the likelihood of a price reversal.
Why is the descending wedge pattern called a falling wedge?
Descending wedge patterns are often referred to as “falling wedge patterns” because they exhibit a wedge-shaped formation where both the upper and lower trendlines slope downward. This pattern is characterized by a narrowing range between these trendlines as the price moves lower within the formation. The term “falling” in “falling wedge” refers to the downward slope of these trendlines.
The descending wedge is typically considered a bullish reversal pattern when observed in a downtrend. It suggests that the downward momentum is weakening as the price range contracts, potentially signaling a reversal in trend direction. Traders regularly look for a breakout above the upper trendline of the wedge as a confirmation of bullish momentum and a potential entry point for long positions.
Why is the ascending wedge pattern called a rising wedge?
It is called a “rising wedge” because it forms a wedge shape where both the upper and lower trendlines slope upward. This pattern typically occurs in uptrends and is characterized by a narrowing price range between these trendlines as the price moves higher within the formation. The term “rising” in “rising wedge” refers to the upward slope of these trendlines.
Traders often interpret this pattern as a potential bearish reversal pattern. It suggests that the upward momentum is weakening as the price range contracts, potentially indicating a reversal in trend direction. The breakdown below the lower trendline of the wedge is often seen as confirmation of bearish momentum and a potential entry point for short positions.
What are the key indicators to look for when trading wedge pattern stocks?
To trade effectively using wedge patterns, it’s important to use technical indicators that can help confirm breakouts and identify potential entry and exit points.
- Volume
- Relative Strength Index (RSI)
- Moving Averages
- Bollinger Bands
- Stochastic Oscillator
- Average Directional Index (ADX)
- Momentum
Why is volume so important for the technical analysis?
Volume is an important indicator in the technical analysis of wedge patterns because it confirms breakouts, identifies trend weakness, determines reversal points, and confirms momentum.
Breakout confirmation. Confirms that the breakout is real and supported by strong trader interest. High volume indicates that the market accepts the new direction.
Identifying trend weakness. Indicates that the trend’s momentum is weakening, and market participants are uncertain about the future direction.
Identifying reversal points. If the price continues to rise or fall but the volume does not support this movement, it can indicate an approaching reversal of the wedge pattern.
Momentum Confirmation. Rising volume during a breakout indicates strong momentum and a high probability of continuing the new trend. Weak volume during a breakout may indicate weak momentum and a potential false breakout.
Pingback: Stock Market Patterns Bulls & Bears
Pingback: Stock Market Patterns, 12 options Stock 'n Investments