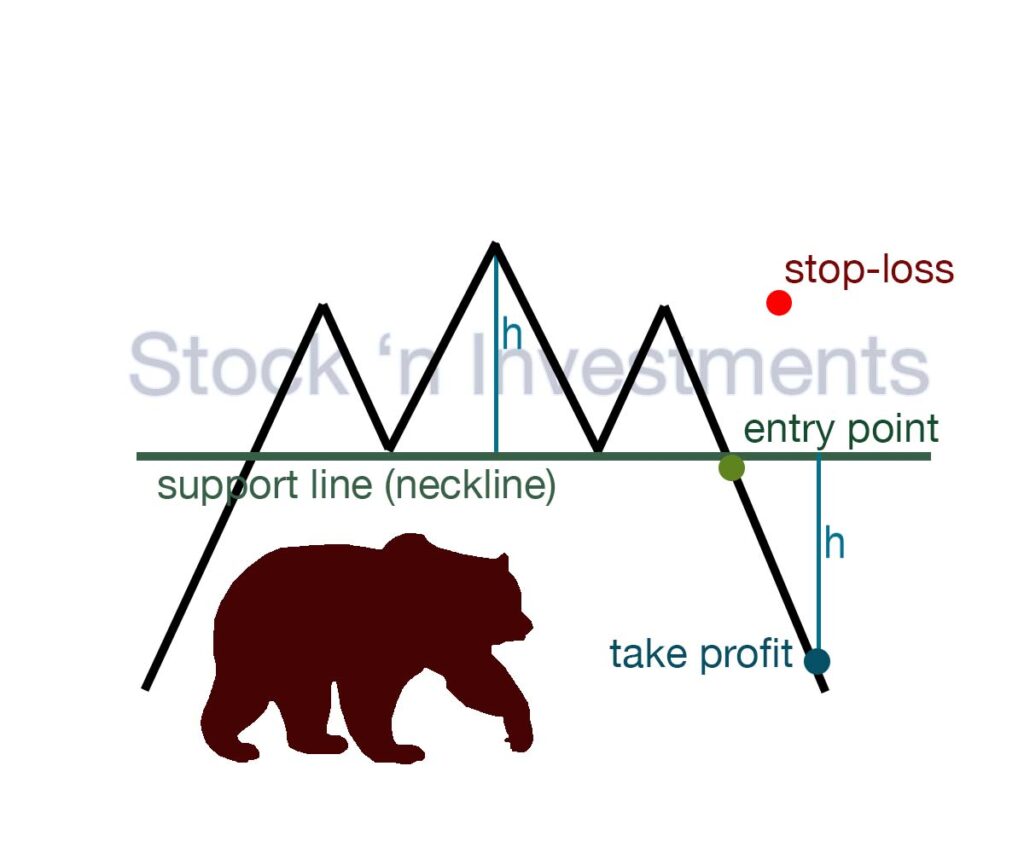
The head and shoulders chart pattern is a popular stock market patterns that signal a potential reversal in trend. There is the classic and the inverse head and shoulders, which indicates a bullish reversal in a downtrend when the price breaks above the neckline. For successful trading, it is essential to correctly determine entry and exit points, as well as to learn how to use technical indicators. And of course, use a stop-loss to minimize losses from a false breakout.

Head and shoulders chart pattern entry point
To understand when to enter a position, you only need to follow these simple steps:
- ensure the formation matches the head and shoulders pattern or the inverse head and shoulders pattern (for bullish reversals).
- after, draw a line through the troughs (in the classic pattern) or peaks (in the inverted pattern) connecting both shoulders. The entry point is at the breakout of the neckline.
- enter the position when the price closes above (for the inverted pattern) or below (for the classic pattern) the neckline.
Head and shoulders pattern exit point
To correctly determine when to exit a position, you need to do the following:
- determine the height of the pattern by measuring the distance from the top of the head to the neckline. Project this distance from the neckline to find the target price.
- use a trailing stop to protect profits, which will automatically adjust as the price moves in your favor.
- analyze indicators and horizontal support or resistance levels for more precise exit points.
Protective Stop-Loss
Stop-loss is used to minimize risk in the event of a false breakout. Place the stop-loss slightly above (for the classic pattern) or below (for the inverted pattern) the highest or lowest point of the second shoulder. This helps minimize risks in case of a false breakout.
What is an example of a trailing stop for the head and shoulders chart pattern?
A trailing stop for the pattern is a type of stop-loss order that automatically adjusts to protect profits as the price moves in a favorable direction. In the context of the head and shoulders formation, a trailing stop is used to preserve gains after the price has moved a certain distance following the neckline breakout. This allows traders to stay in the position as long as the price continues to move favorably, but it will automatically close the position if the price reverses and moves against them.
Suppose the price breaks the neckline at $100 and the trader enters a short position. By setting a trailing stop at 5%, the initial stop-loss would be set at $105. If the price drops to $90, the trailing stop would automatically move to $94.50 (90 + 5%). If the price then rises to $94.50, the position would automatically close, protecting the profit.
What does it mean to execute the entry point in a head and shoulders chart pattern?
Executing the entry point in the pattern means buying the asset when the price breaks above the resistance level at the top of the handle. This typically signals a potential continuation of the upward trend, and traders use this point as the moment to enter the market in anticipation of further price increases.
What does it mean to open a short position?
Also, you can open short position in head and shoulders chart pattern. To open a short position means to sell an asset (such as stocks, currency, or commodities) that the trader does not own, with the expectation that its price will fall in the future. The trader plans to buy the asset later at a lower price, to return it and profit from the difference in price.
Which technical indicators should be used in a head and shoulders stock pattern?
Each of these technical indicators will be useful in forming the pattern. The key is to correctly interpret the signals.
- Volume
- Relative Strength Index (RSI)
- Moving Averages
- MACD (Moving Average Convergence Divergence)
- Stochastic Oscillator
- Fibonacci Retracement Levels.
How often does a false breakout occur in the head and shoulders chart pattern?
False breakouts in the pattern can occur quite frequently, especially on shorter timeframes or in markets with low liquidity. They can result from various forms of manipulation or simply market indecision. Therefore, it’s essential to use confirming signals and other analysis methods to validate the breakout and avoid falling for false signals.
How do traders typically manage risk?
Traders typically manage risk when trading the formation of stocks. They implement risk management strategies such as setting stop-loss orders, trailing stops, and position sizing based on their risk tolerance and the specific characteristics of the head and shoulders chart pattern. Additionally, some traders may use confirmation signals from other technical indicators or price action to validate the pattern before entering a trade, further minimizing the risk of false breakouts.
How do traders differentiate between a head and shoulders candlestick pattern and other reversal patterns in technical analysis?
Traders differentiate between a head and shoulders chart pattern and other reversal patterns in technical analysis primarily by examining the specific characteristics of each pattern.
In a head and shoulders pattern, traders look for three peaks: a higher peak (the head) flanked by two lower peaks (the shoulders). These peaks are typically accompanied by a neckline connecting the lows of the troughs between them.
To distinguish it from other reversal patterns, traders consider factors such as the symmetry of the shoulders, the volume trends during the formation of the pattern, and the slope of the neckline. Additionally, they compare the pattern to other well-known reversal patterns like double tops or double bottoms, looking for unique features that confirm its classification. By analyzing these aspects, traders can identify whether a pattern aligns with the characteristics of a head and shoulders candlestick pattern or another type of reversal pattern.